Estimated Value: $369,000 - $423,000
3
Beds
3
Baths
2,072
Sq Ft
$189/Sq Ft
Est. Value
About This Home
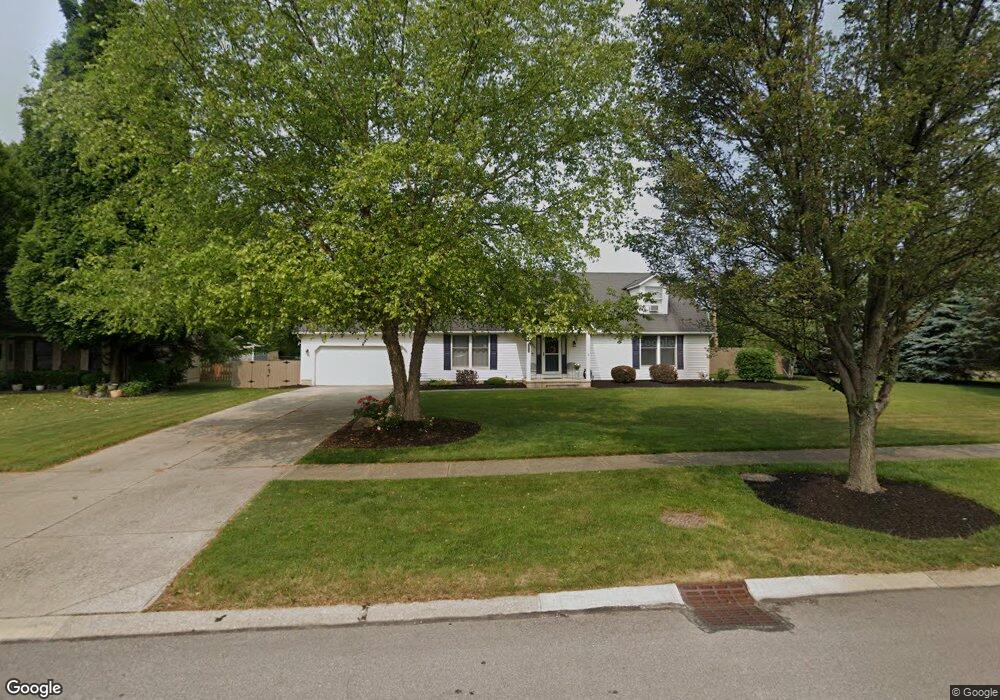
This home is located at 3312 Parkview Dr, Avon, OH 44011 and is currently estimated at $391,824, approximately $189 per square foot. 3312 Parkview Dr is a home located in Lorain County with nearby schools including Avon East Elementary School, Avon Heritage South Elementary School, and Avon Middle School.
Ownership History
Date
Name
Owned For
Owner Type
Purchase Details
Closed on
May 16, 2011
Sold by
Dechant Thomas J
Bought by
Price Cynthia A and Dechant Cynthia A
Current Estimated Value
Purchase Details
Closed on
Jul 19, 2001
Sold by
Charles Anson
Bought by
Dechant Thomas J and Dechant Cynthia A
Home Financials for this Owner
Home Financials are based on the most recent Mortgage that was taken out on this home.
Original Mortgage
$144,000
Interest Rate
7.22%
Purchase Details
Closed on
Dec 9, 1997
Sold by
Frankart Stephen M and Frankart Kimberly M
Bought by
Anson Charles R and Anson Cindy L
Purchase Details
Closed on
Aug 22, 1994
Sold by
Campbell James H
Bought by
Frankart Stephen M and Frankart Kimberly M
Home Financials for this Owner
Home Financials are based on the most recent Mortgage that was taken out on this home.
Original Mortgage
$110,000
Interest Rate
8.73%
Mortgage Type
New Conventional
Create a Home Valuation Report for This Property
The Home Valuation Report is an in-depth analysis detailing your home's value as well as a comparison with similar homes in the area
Home Values in the Area
Average Home Value in this Area
Purchase History
| Date | Buyer | Sale Price | Title Company |
|---|---|---|---|
| Price Cynthia A | -- | Attorney | |
| Dechant Thomas J | $180,000 | Insignia Title | |
| Anson Charles R | $149,000 | -- | |
| Frankart Stephen M | $140,000 | -- |
Source: Public Records
Mortgage History
| Date | Status | Borrower | Loan Amount |
|---|---|---|---|
| Previous Owner | Dechant Thomas J | $144,000 | |
| Previous Owner | Frankart Stephen M | $110,000 | |
| Closed | Dechant Thomas J | $18,000 |
Source: Public Records
Tax History Compared to Growth
Tax History
| Year | Tax Paid | Tax Assessment Tax Assessment Total Assessment is a certain percentage of the fair market value that is determined by local assessors to be the total taxable value of land and additions on the property. | Land | Improvement |
|---|---|---|---|---|
| 2024 | $4,633 | $94,255 | $20,164 | $74,092 |
| 2023 | $4,601 | $83,171 | $18,522 | $64,649 |
| 2022 | $4,557 | $83,171 | $18,522 | $64,649 |
| 2021 | $4,567 | $83,171 | $18,522 | $64,649 |
| 2020 | $4,221 | $72,140 | $16,070 | $56,070 |
| 2019 | $4,134 | $72,140 | $16,070 | $56,070 |
| 2018 | $3,604 | $72,140 | $16,070 | $56,070 |
| 2017 | $3,378 | $59,270 | $15,170 | $44,100 |
| 2016 | $3,418 | $59,270 | $15,170 | $44,100 |
| 2015 | $3,452 | $59,270 | $15,170 | $44,100 |
| 2014 | $3,008 | $52,080 | $13,330 | $38,750 |
| 2013 | $3,024 | $52,080 | $13,330 | $38,750 |
Source: Public Records
Map
Nearby Homes
- 3181 Jaycox Rd
- 35086 Saddle Creek
- 34022 Hickory Ct
- 3850 Jaycox Rd
- 2852 Jaycox Rd
- 34004 Hickory Ct
- The Katherine Plan at Autumn Grove
- The Stony Brook Plan at Autumn Grove
- The Hampton Plan at Autumn Grove
- The Cambridge Plan at Autumn Grove
- The Alexander Plan at Autumn Grove
- The Legacy Plan at Autumn Grove
- The Avondale Plan at Autumn Grove
- The Linville Plan at Autumn Grove
- The Halsted Plan at Autumn Grove
- The Conventry II Plan at Autumn Grove
- The Hillcrest Plan at Autumn Grove
- The Hannah Plan at Autumn Grove
- The Savannah Plan at Autumn Grove
- The Westlake Plan at Autumn Grove
- 3338 Parkview Dr
- 3317 Jaycox Rd
- 3360 Parkview Dr
- 3309 Parkview Dr
- 3335 Parkview Dr
- 3343 Jaycox Rd
- 3357 Parkview Dr
- 3382 Parkview Dr
- 3365 Jaycox Rd
- 35094 Schwartz Rd
- 35062 Schwartz Rd
- 35050 Schwartz Rd
- 3379 Parkview Dr
- 3404 Parkview Dr
- 3387 Jaycox Rd
- 3401 Parkview Dr
- 3409 Jaycox Rd
- 3428 Parkview Dr
- 3425 Parkview Dr
- 3285 Jaycox Rd