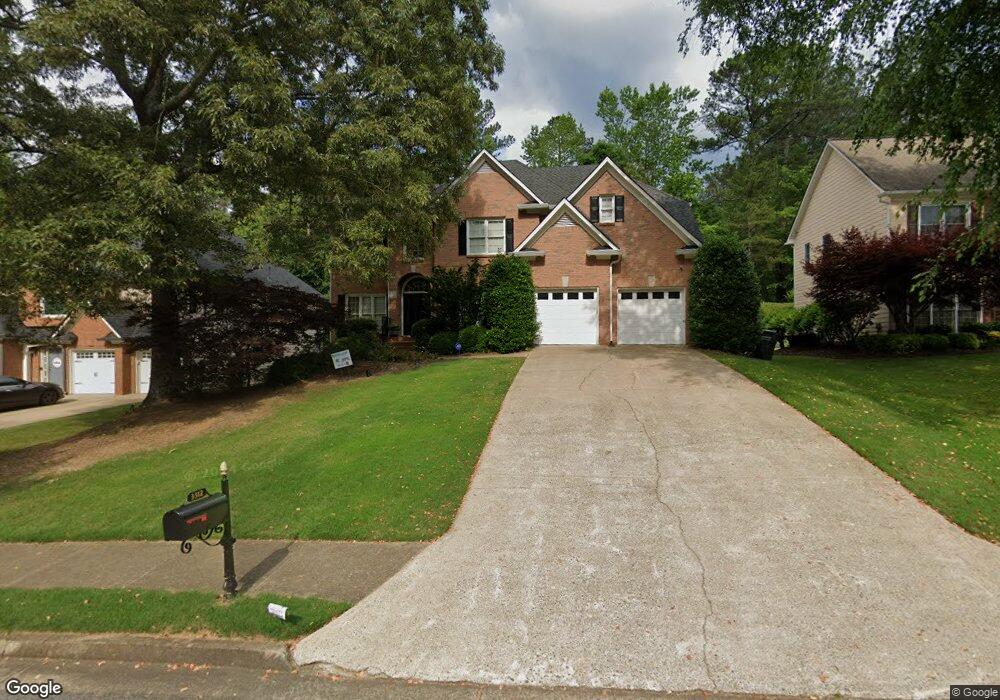
3312 Stillbrook Pass Marietta, GA 30062
East Cobb NeighborhoodEstimated Value: $760,000 - $889,000
5
Beds
3
Baths
3,741
Sq Ft
$218/Sq Ft
Est. Value
About This Home
This home is located at 3312 Stillbrook Pass, Marietta, GA 30062 and is currently estimated at $815,148, approximately $217 per square foot. 3312 Stillbrook Pass is a home located in Cobb County with nearby schools including Mountain View Elementary School, Hightower Trail Middle School, and Pope High School.
Ownership History
Date
Name
Owned For
Owner Type
Purchase Details
Closed on
Nov 12, 2010
Sold by
Federal Home Loan Mortgage Corporation
Bought by
Grimes Teka L and Grimes Onaje R
Current Estimated Value
Home Financials for this Owner
Home Financials are based on the most recent Mortgage that was taken out on this home.
Original Mortgage
$284,050
Outstanding Balance
$187,252
Interest Rate
4.33%
Mortgage Type
New Conventional
Estimated Equity
$627,896
Purchase Details
Closed on
May 4, 2010
Sold by
Chase Hm Fin Llc
Bought by
Federal Home Loan Mortgage Corporation
Purchase Details
Closed on
Jul 28, 2004
Sold by
Yi Michael J and Yi Susan K
Bought by
Yi Mun Y
Home Financials for this Owner
Home Financials are based on the most recent Mortgage that was taken out on this home.
Original Mortgage
$321,300
Interest Rate
6.22%
Mortgage Type
New Conventional
Purchase Details
Closed on
Jun 14, 1996
Sold by
Peachtree Residential Props Inc
Bought by
Yi Michael J
Create a Home Valuation Report for This Property
The Home Valuation Report is an in-depth analysis detailing your home's value as well as a comparison with similar homes in the area
Home Values in the Area
Average Home Value in this Area
Purchase History
| Date | Buyer | Sale Price | Title Company |
|---|---|---|---|
| Grimes Teka L | $299,000 | -- | |
| Federal Home Loan Mortgage Corporation | -- | -- | |
| Chase Hm Fin Llc | $280,140 | -- | |
| Yi Mun Y | $357,000 | -- | |
| Yi Michael J | $241,000 | -- |
Source: Public Records
Mortgage History
| Date | Status | Borrower | Loan Amount |
|---|---|---|---|
| Open | Grimes Teka L | $284,050 | |
| Previous Owner | Yi Mun Y | $321,300 |
Source: Public Records
Tax History Compared to Growth
Tax History
| Year | Tax Paid | Tax Assessment Tax Assessment Total Assessment is a certain percentage of the fair market value that is determined by local assessors to be the total taxable value of land and additions on the property. | Land | Improvement |
|---|---|---|---|---|
| 2025 | $7,043 | $289,464 | $68,000 | $221,464 |
| 2024 | $6,819 | $278,860 | $46,000 | $232,860 |
| 2023 | $6,276 | $278,860 | $46,000 | $232,860 |
| 2022 | $5,070 | $196,508 | $46,000 | $150,508 |
| 2021 | $5,070 | $196,508 | $46,000 | $150,508 |
| 2020 | $5,070 | $196,508 | $46,000 | $150,508 |
| 2019 | $4,705 | $179,852 | $42,000 | $137,852 |
| 2018 | $4,705 | $179,852 | $42,000 | $137,852 |
| 2017 | $4,074 | $159,064 | $36,000 | $123,064 |
| 2016 | $3,745 | $143,956 | $38,000 | $105,956 |
| 2015 | $3,263 | $119,600 | $35,348 | $84,252 |
| 2014 | $3,291 | $119,600 | $0 | $0 |
Source: Public Records
Map
Nearby Homes
- 3447 Dry Creek Rd
- 3601 Cherbourg Way
- 3148 Cherbourg Ct
- 3310 Rangers Gate
- 3312 Winter Wood Ct
- 3461 Salem Trace
- 3503 Liberty Ridge Trail
- 2866 Lexington Trace
- 3134 Hudson Pond Ln
- 3523 Liberty Ridge Trail
- 3333 N Hembree Rd
- 2864 Sudbury Ct
- 2872 Suffolk Ct
- 2735 Wendy Ln
- 2760 Hembree Rd NE
- 3605 Shallowford Rd
- 3071 Intrepid Wake
- 3314 Stillbrook Pass
- 3310 Stillbrook Pass
- 3308 Stillbrook Pass
- 3316 Stillbrook Pass
- 3187 Hickory Bluff Dr
- 3311 Stillbrook Pass
- 3309 Stillbrook Pass
- 3197 Hickory Bluff Dr
- 3306 Stillbrook Pass
- 3391 Dry Creek Rd
- 0 Stillbrook Pass Unit 7022730
- 3404 Stillbrook Way
- 3313 Stillbrook Pass
- 3304 Stillbrook Pass
- 3318 Stillbrook Pass
- 3406 Stillbrook Way
- 3307 Stillbrook Pass
- 3203 Hickory Bluff Dr
- 3315 Stillbrook Pass
- 3305 Stillbrook Pass