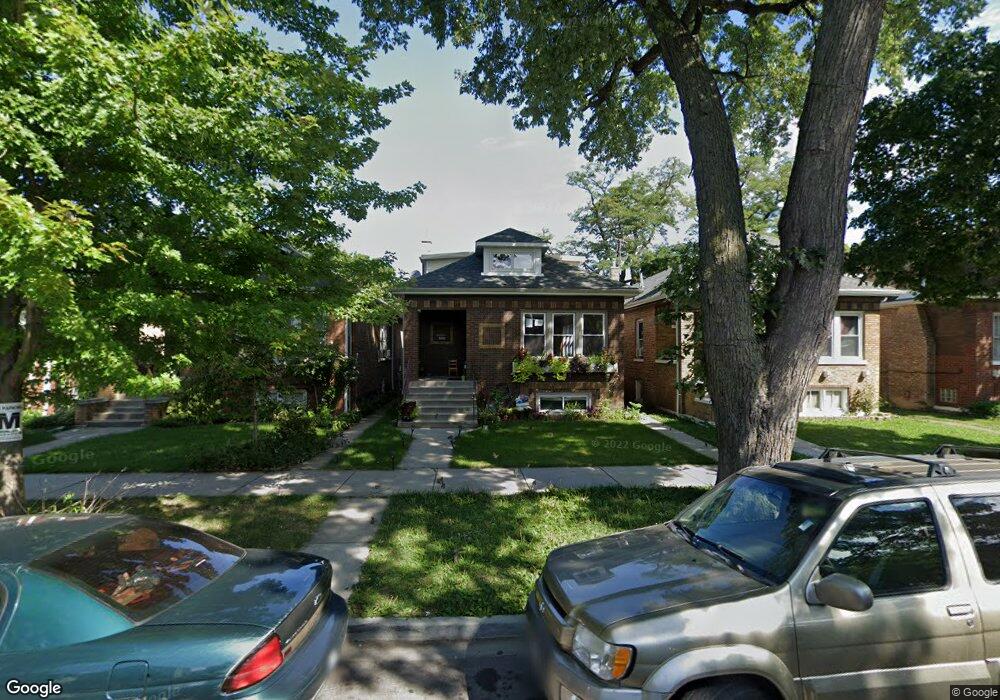
3312 W 65th St Chicago, IL 60629
Marquette Park NeighborhoodEstimated Value: $300,725 - $325,000
4
Beds
2
Baths
1,763
Sq Ft
$175/Sq Ft
Est. Value
About This Home
This home is located at 3312 W 65th St, Chicago, IL 60629 and is currently estimated at $309,181, approximately $175 per square foot. 3312 W 65th St is a home located in Cook County with nearby schools including Eberhart Elementary School, Hubbard High School, and Catalyst Maria Charter School.
Ownership History
Date
Name
Owned For
Owner Type
Purchase Details
Closed on
Mar 3, 2023
Sold by
Pinon Ricardo
Bought by
Pinon Ricardo and Pinon Antonio
Current Estimated Value
Home Financials for this Owner
Home Financials are based on the most recent Mortgage that was taken out on this home.
Original Mortgage
$208,000
Outstanding Balance
$202,497
Interest Rate
7.63%
Mortgage Type
New Conventional
Estimated Equity
$106,684
Purchase Details
Closed on
Jul 18, 2005
Sold by
Figueroa Gabriel and Figueroa Leisa Marie
Bought by
Pinon Ricardo
Home Financials for this Owner
Home Financials are based on the most recent Mortgage that was taken out on this home.
Original Mortgage
$180,000
Interest Rate
6.15%
Mortgage Type
Unknown
Purchase Details
Closed on
Oct 30, 1997
Sold by
Acevedo Marin and Acevedo Contance M
Bought by
Figueroa Gabriel
Home Financials for this Owner
Home Financials are based on the most recent Mortgage that was taken out on this home.
Original Mortgage
$86,401
Interest Rate
7.38%
Mortgage Type
FHA
Create a Home Valuation Report for This Property
The Home Valuation Report is an in-depth analysis detailing your home's value as well as a comparison with similar homes in the area
Home Values in the Area
Average Home Value in this Area
Purchase History
| Date | Buyer | Sale Price | Title Company |
|---|---|---|---|
| Pinon Ricardo | -- | None Listed On Document | |
| Pinon Ricardo | $225,000 | Ticor Title Insurance | |
| Figueroa Gabriel | $86,000 | -- |
Source: Public Records
Mortgage History
| Date | Status | Borrower | Loan Amount |
|---|---|---|---|
| Open | Pinon Ricardo | $208,000 | |
| Previous Owner | Pinon Ricardo | $180,000 | |
| Previous Owner | Figueroa Gabriel | $86,401 |
Source: Public Records
Tax History
| Year | Tax Paid | Tax Assessment Tax Assessment Total Assessment is a certain percentage of the fair market value that is determined by local assessors to be the total taxable value of land and additions on the property. | Land | Improvement |
|---|---|---|---|---|
| 2025 | $3,818 | $21,000 | $1,860 | $19,140 |
| 2024 | $3,818 | $21,000 | $1,860 | $19,140 |
| 2023 | $3,723 | $19,110 | $3,162 | $15,948 |
| 2022 | $3,723 | $19,110 | $3,162 | $15,948 |
| 2021 | $3,620 | $18,000 | $3,162 | $14,838 |
| 2020 | $3,293 | $14,688 | $3,162 | $11,526 |
| 2019 | $3,375 | $16,691 | $3,162 | $13,529 |
| 2018 | $3,318 | $16,691 | $3,162 | $13,529 |
| 2017 | $3,241 | $14,958 | $2,790 | $12,168 |
| 2016 | $3,016 | $14,958 | $2,790 | $12,168 |
| 2015 | $2,761 | $14,958 | $2,790 | $12,168 |
| 2014 | $2,600 | $13,907 | $2,604 | $11,303 |
| 2013 | $2,550 | $13,907 | $2,604 | $11,303 |
Source: Public Records
Map
Nearby Homes
- 3343 W 64th Place
- 3416 W 64th Place
- 3424 W 64th Place
- 3220 W 66th St
- 3411 W 63rd Place
- 6339 S Troy St
- 6319 S Troy St
- 6409 S Albany Ave
- 3604 W 65th Place
- 6333 S Whipple St
- 3313 W 61st Place
- 3545 W 62nd Place
- 3651 W 64th Place
- 3501 W 61st Place
- 6341 S Richmond St
- 6210 S Sacramento Ave
- 3511 W 61st St
- 3320 W 60th Place
- 3700 W 63rd St
- 6512 S Mozart St
- 3316 W 65th St
- 3310 W 65th St
- 3318 W 65th St
- 3306 W 65th St
- 3322 W 65th St
- 3300 W 65th St
- 3324 W 65th St
- 3315 W 64th Place
- 3317 W 64th Place
- 3311 W 64th Place
- 3328 W 65th St
- 3319 W 64th Place
- 3307 W 64th Place
- 3323 W 64th Place
- 3330 W 65th St
- 3301 W 64th Place
- 3325 W 64th Place
- 3313 W 65th St
- 3311 W 65th St
- 3319 W 65th St
Your Personal Tour Guide
Ask me questions while you tour the home.