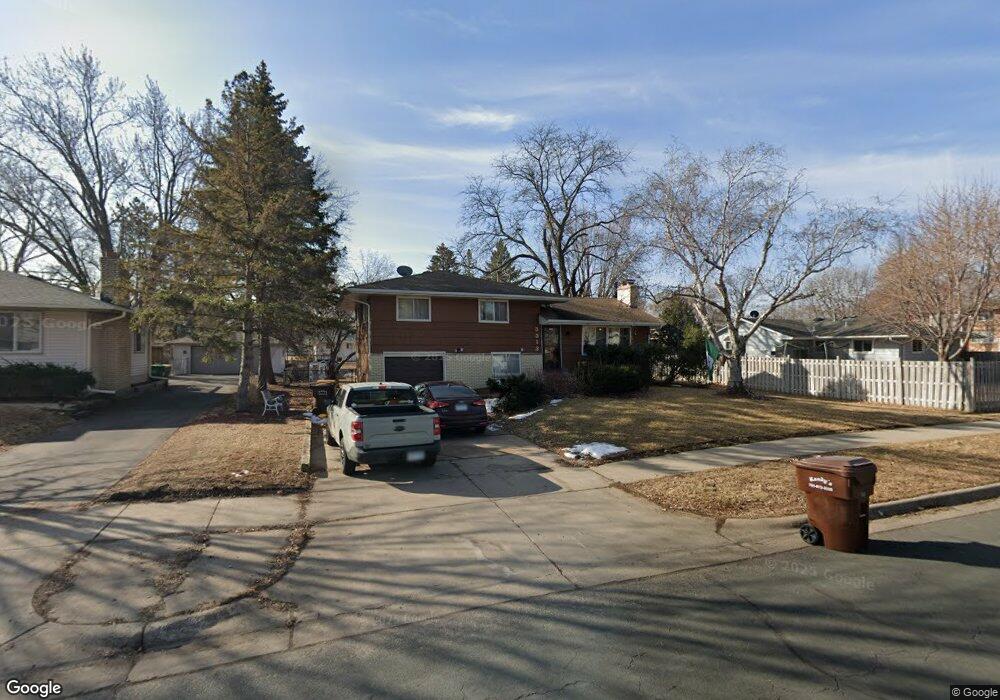
3313 3313 65th-Avenue-n Brooklyn Center, MN 55429
Garden City NeighborhoodEstimated Value: $319,240 - $339,000
3
Beds
2
Baths
1,400
Sq Ft
$233/Sq Ft
Est. Value
About This Home
This home is located at 3313 3313 65th-Avenue-n, Brooklyn Center, MN 55429 and is currently estimated at $325,810, approximately $232 per square foot. 3313 3313 65th-Avenue-n is a home located in Hennepin County with nearby schools including Garden City Elementary School, Park Center Senior High, and Progeny Academy.
Ownership History
Date
Name
Owned For
Owner Type
Purchase Details
Closed on
Aug 31, 2023
Sold by
Christian Victoria A and Christian Hassan E
Bought by
Stepanian-Bennett Peter
Current Estimated Value
Home Financials for this Owner
Home Financials are based on the most recent Mortgage that was taken out on this home.
Original Mortgage
$218,762
Outstanding Balance
$213,990
Interest Rate
6.81%
Mortgage Type
FHA
Estimated Equity
$111,820
Purchase Details
Closed on
May 20, 2015
Sold by
Shop 2012 Llc
Bought by
Christian Victoria A and Christian Hassan E
Home Financials for this Owner
Home Financials are based on the most recent Mortgage that was taken out on this home.
Original Mortgage
$146,418
Interest Rate
4%
Mortgage Type
FHA
Purchase Details
Closed on
May 31, 2013
Sold by
Shop 2012 Llc
Bought by
Christian Victoria A and Christian Hassan E
Create a Home Valuation Report for This Property
The Home Valuation Report is an in-depth analysis detailing your home's value as well as a comparison with similar homes in the area
Home Values in the Area
Average Home Value in this Area
Purchase History
| Date | Buyer | Sale Price | Title Company |
|---|---|---|---|
| Stepanian-Bennett Peter | $290,205 | Guardian Title | |
| Christian Victoria A | $141,200 | Executive Title Inc | |
| Christian Victoria A | $141,200 | None Available | |
| Shop 2012 Llc | $136,852 | Liberty Title Inc |
Source: Public Records
Mortgage History
| Date | Status | Borrower | Loan Amount |
|---|---|---|---|
| Open | Stepanian-Bennett Peter | $218,762 | |
| Previous Owner | Christian Victoria A | $146,418 | |
| Closed | Christian Victoria A | $0 |
Source: Public Records
Tax History Compared to Growth
Tax History
| Year | Tax Paid | Tax Assessment Tax Assessment Total Assessment is a certain percentage of the fair market value that is determined by local assessors to be the total taxable value of land and additions on the property. | Land | Improvement |
|---|---|---|---|---|
| 2024 | $3,992 | $276,000 | $83,000 | $193,000 |
| 2023 | $3,945 | $276,300 | $86,000 | $190,300 |
| 2022 | $3,117 | $266,000 | $79,000 | $187,000 |
| 2021 | $3,096 | $226,000 | $67,000 | $159,000 |
| 2020 | $3,042 | $211,000 | $57,000 | $154,000 |
| 2019 | $2,986 | $202,000 | $65,000 | $137,000 |
| 2018 | $2,713 | $188,000 | $54,000 | $134,000 |
| 2017 | $2,471 | $157,000 | $46,000 | $111,000 |
| 2016 | $2,575 | $160,400 | $44,500 | $115,900 |
| 2015 | -- | $143,400 | $39,500 | $103,900 |
| 2014 | -- | $130,500 | $34,400 | $96,100 |
Source: Public Records
Map
Nearby Homes
- 2812 64th Ave N
- 2925 69th Ln N
- 6843 York Place N
- 3801 69th Ave N
- 6019 Zenith Ave N
- 4309 63rd Ave N
- 4418 65th Ave N
- 5942 Zenith Ave N
- 5932 Admiral Ln N
- 6413 Noble Ave N
- 3500 72nd Ave N
- 5808 Pearson Dr
- 6318 Perry Ave N
- 5007 65th Ave N
- 6807 Quail Ave N
- 4710 58th Ave N Unit 208
- 4710 58th Ave N Unit 202
- 4710 58th Ave N Unit 219
- 4710 58th Ave N Unit 221
- 4710 58th Ave N Unit 319
- 3313 65th Ave N
- 3307 65th Ave N
- 6406 Beard Ave N
- 3312 64th Ave N
- 3312 3312 64th-Avenue-n
- 3318 64th Ave N
- 3306 64th Ave N
- 3306 64th Ave N
- 3312 65th Ave N
- 3306 3306 65th-Avenue-n
- 3300 64th Ave N
- 3306 65th Ave N
- 3219 65th Ave N
- 3219 3219 65th-Avenue-n
- 6500 Beard Ave N
- 3300 65th Ave N
- 3224 64th Ave N
- 3224 3224 65th-Avenue-n
- 3224 65th Ave N
- 3213 65th Ave N