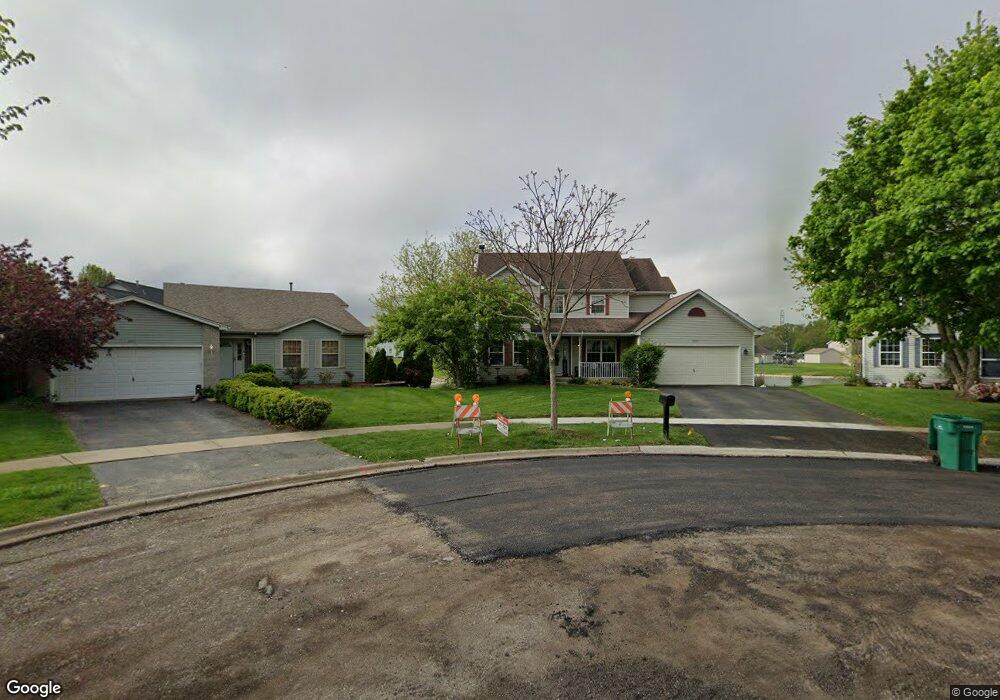
3313 Concord Ct Lockport, IL 60441
Crystal Lawns NeighborhoodEstimated Value: $338,878 - $424,000
4
Beds
4
Baths
2,459
Sq Ft
$163/Sq Ft
Est. Value
About This Home
This home is located at 3313 Concord Ct, Lockport, IL 60441 and is currently estimated at $400,970, approximately $163 per square foot. 3313 Concord Ct is a home located in Will County with nearby schools including Crystal Lawns Elementary School, Timber Ridge Middle School, and Plainfield Central High School.
Ownership History
Date
Name
Owned For
Owner Type
Purchase Details
Closed on
Jul 7, 2004
Sold by
Sharon Lawrence H and Sharon Patricia L
Bought by
Minnito Dominic and Minnito Felicia I
Current Estimated Value
Home Financials for this Owner
Home Financials are based on the most recent Mortgage that was taken out on this home.
Original Mortgage
$167,000
Outstanding Balance
$84,520
Interest Rate
6.42%
Mortgage Type
Purchase Money Mortgage
Estimated Equity
$316,450
Purchase Details
Closed on
Aug 14, 1998
Sold by
Chicago Title Land Trust Company
Bought by
Sharon Lawrence H and Sharon Patricia L
Home Financials for this Owner
Home Financials are based on the most recent Mortgage that was taken out on this home.
Original Mortgage
$172,400
Interest Rate
7.04%
Create a Home Valuation Report for This Property
The Home Valuation Report is an in-depth analysis detailing your home's value as well as a comparison with similar homes in the area
Home Values in the Area
Average Home Value in this Area
Purchase History
| Date | Buyer | Sale Price | Title Company |
|---|---|---|---|
| Minnito Dominic | $236,000 | Ticor Title | |
| Sharon Lawrence H | $181,500 | Chicago Title Insurance Co |
Source: Public Records
Mortgage History
| Date | Status | Borrower | Loan Amount |
|---|---|---|---|
| Open | Minnito Dominic | $167,000 | |
| Previous Owner | Sharon Lawrence H | $172,400 |
Source: Public Records
Tax History Compared to Growth
Tax History
| Year | Tax Paid | Tax Assessment Tax Assessment Total Assessment is a certain percentage of the fair market value that is determined by local assessors to be the total taxable value of land and additions on the property. | Land | Improvement |
|---|---|---|---|---|
| 2024 | $7,453 | $111,776 | $27,445 | $84,331 |
| 2023 | $7,453 | $100,954 | $24,788 | $76,166 |
| 2022 | $7,361 | $99,737 | $24,489 | $75,248 |
| 2021 | $6,980 | $93,212 | $22,887 | $70,325 |
| 2020 | $6,875 | $90,568 | $22,238 | $68,330 |
| 2019 | $7,104 | $91,958 | $21,189 | $70,769 |
| 2018 | $6,802 | $86,399 | $19,908 | $66,491 |
| 2017 | $6,601 | $82,105 | $18,919 | $63,186 |
| 2016 | $6,469 | $78,307 | $18,044 | $60,263 |
| 2015 | $6,342 | $73,355 | $16,903 | $56,452 |
| 2014 | $6,342 | $70,765 | $16,306 | $54,459 |
| 2013 | $6,342 | $73,991 | $16,306 | $57,685 |
Source: Public Records
Map
Nearby Homes
- 3511 Sumac Dr
- 21543 Eich Dr
- 21533 Cormorant St
- 16416 Crescent Lake Ct
- 16400 Crescent Lake Dr
- 3714 Harms Rd
- 21522 Lake st Clair Dr
- 2408 Chestnut St
- 21316 Brush Lake Dr
- 21531 Wolf Lake Way
- 21308 Brush Lake Dr
- 21546 Victory Lake Way Unit 8
- 21201 Lily Lake Ln
- 16613 Buckner Pond Way
- 16400 Grandwood Lake Dr
- 16415 Grandwood Lake Dr
- 16012 Carillon Lakes Ct
- 2419 Grape St
- 16163 Seneca Lake Cir
- Lot #3 S End Rd
- 3315 Concord Ct
- 3311 Concord Ct
- 2425 Lakeridge Dr
- 3309 Concord Ct
- 3317 Concord Ct
- 2423 Lakeridge Dr
- 3319 Concord Ct
- 3304 Kasey Ct
- 3321 Concord Ct
- 3306 Kasey Ct
- 2454 Lakeridge Dr
- 3302 Kasey Ct
- 3217 Heritage Lake Dr
- 3308 Kasey Ct
- 2428 Lakeridge Dr Unit 3
- 3310 Concord Ct Unit 3
- 2430 Lakeridge Dr
- 2424 Lakeridge Dr
- 3213 Sunset Ct
- 3211 Sunset Ct