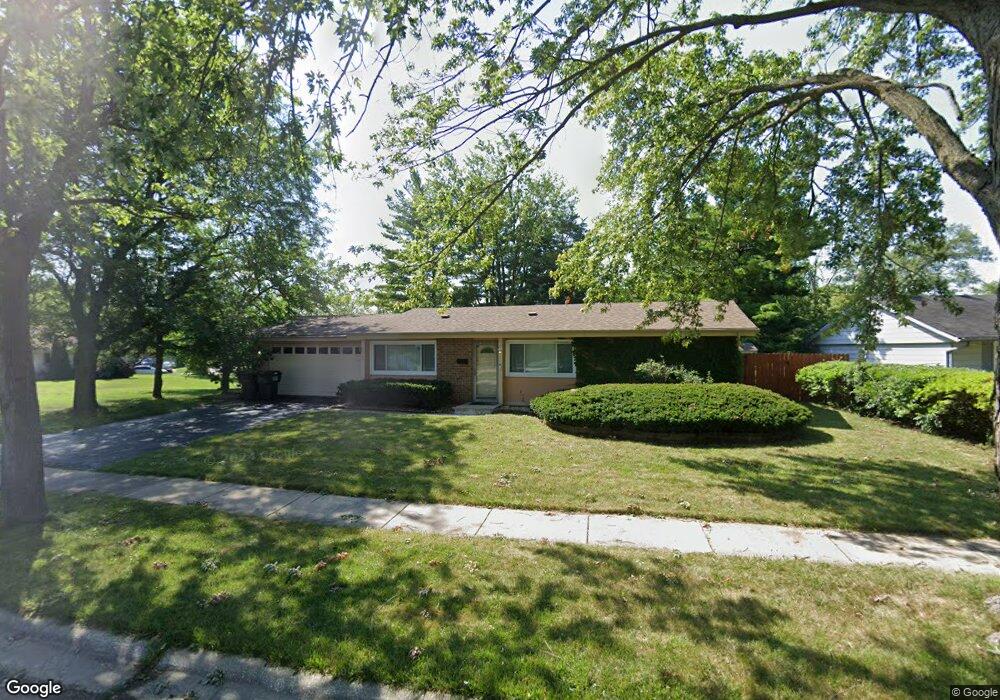
3313 Fountainbleau Dr Hazel Crest, IL 60429
Chateaux-Versailles NeighborhoodEstimated Value: $207,000 - $270,000
3
Beds
1
Bath
1,335
Sq Ft
$168/Sq Ft
Est. Value
About This Home
This home is located at 3313 Fountainbleau Dr, Hazel Crest, IL 60429 and is currently estimated at $224,053, approximately $167 per square foot. 3313 Fountainbleau Dr is a home located in Cook County with nearby schools including Chateaux School, Prairie-Hills Junior High School, and Hillcrest High School.
Ownership History
Date
Name
Owned For
Owner Type
Purchase Details
Closed on
Sep 4, 2008
Sold by
Us Bank Na
Bought by
Brownridge Antoine D
Current Estimated Value
Home Financials for this Owner
Home Financials are based on the most recent Mortgage that was taken out on this home.
Original Mortgage
$88,611
Interest Rate
6.52%
Mortgage Type
FHA
Purchase Details
Closed on
May 22, 2008
Sold by
Banks Anita W
Bought by
Us Bank Na and Structured Asset Securities Corp Trust 2
Purchase Details
Closed on
May 20, 2005
Sold by
Jones Rosemary C
Bought by
Banks Anita W
Home Financials for this Owner
Home Financials are based on the most recent Mortgage that was taken out on this home.
Original Mortgage
$128,000
Interest Rate
6.87%
Mortgage Type
Fannie Mae Freddie Mac
Purchase Details
Closed on
Sep 30, 2004
Sold by
Dunham Gloria
Bought by
Jones Rosemary C
Home Financials for this Owner
Home Financials are based on the most recent Mortgage that was taken out on this home.
Original Mortgage
$113,933
Interest Rate
5.93%
Mortgage Type
FHA
Create a Home Valuation Report for This Property
The Home Valuation Report is an in-depth analysis detailing your home's value as well as a comparison with similar homes in the area
Home Values in the Area
Average Home Value in this Area
Purchase History
| Date | Buyer | Sale Price | Title Company |
|---|---|---|---|
| Brownridge Antoine D | $90,000 | Attorneys Title Guaranty Fun | |
| Us Bank Na | -- | None Available | |
| Banks Anita W | $128,000 | Ticor Title Insurance Compan | |
| Jones Rosemary C | $115,000 | Chicago Title Insurance Comp |
Source: Public Records
Mortgage History
| Date | Status | Borrower | Loan Amount |
|---|---|---|---|
| Closed | Brownridge Antoine D | $88,611 | |
| Previous Owner | Banks Anita W | $128,000 | |
| Previous Owner | Jones Rosemary C | $113,933 |
Source: Public Records
Tax History Compared to Growth
Tax History
| Year | Tax Paid | Tax Assessment Tax Assessment Total Assessment is a certain percentage of the fair market value that is determined by local assessors to be the total taxable value of land and additions on the property. | Land | Improvement |
|---|---|---|---|---|
| 2024 | $5,985 | $15,000 | $3,295 | $11,705 |
| 2023 | $4,631 | $15,000 | $3,295 | $11,705 |
| 2022 | $4,631 | $9,729 | $2,824 | $6,905 |
| 2021 | $4,527 | $9,728 | $2,824 | $6,904 |
| 2020 | $4,451 | $9,728 | $2,824 | $6,904 |
| 2019 | $4,147 | $9,623 | $2,588 | $7,035 |
| 2018 | $4,015 | $9,623 | $2,588 | $7,035 |
| 2017 | $4,277 | $10,431 | $2,588 | $7,843 |
| 2016 | $4,038 | $9,403 | $2,353 | $7,050 |
| 2015 | $3,797 | $9,403 | $2,353 | $7,050 |
| 2014 | $3,734 | $9,403 | $2,353 | $7,050 |
| 2013 | $3,805 | $10,574 | $2,353 | $8,221 |
Source: Public Records
Map
Nearby Homes
- 3407 Fountainbleau Dr
- 3411 Montmarte Ave
- 18106 Charlemagne Ave
- 17922 Normandy Ln
- 3400 Seine Ct
- 3406 Seine Ct
- 18120 Versailles Ln
- 17910 Millstone Rd
- 17850 Yale Ln
- 3112 Shagbark Ln
- 3114 Shagbark Ln
- 17861 Harvard Ln
- 3525 Marseilles Ln
- 18018 Chantilly Ln Unit S3
- 3068 Hickory Rd
- 18108 Fountainbleau Dr
- 17710 Harvard Ln
- 18208 Fountainbleau Dr
- 3255 183rd St
- 17617 Central Park Ave
- 3315 Fountainbleau Dr
- 3316 Montmarte Ave
- 3314 Montmarte Ave
- 3318 Montmarte Ave
- 3317 Fountainbleau Dr
- 3312 Fountainbleau Dr
- 3320 Montmarte Ave
- 3401 Fountainbleau Dr
- 3310 Chambord Ln
- 3316 Fountainbleau Dr
- 3322 Montmarte Ave
- 3312 Chambord Ln
- 3400 Fountainbleau Dr
- 3313 Chambord Ln
- 3403 Fountainbleau Dr
- 3317 Montmarte Ave
- 3324 Montmarte Ave
- 17910 Chartres Ct
- 3319 Montmarte Ave