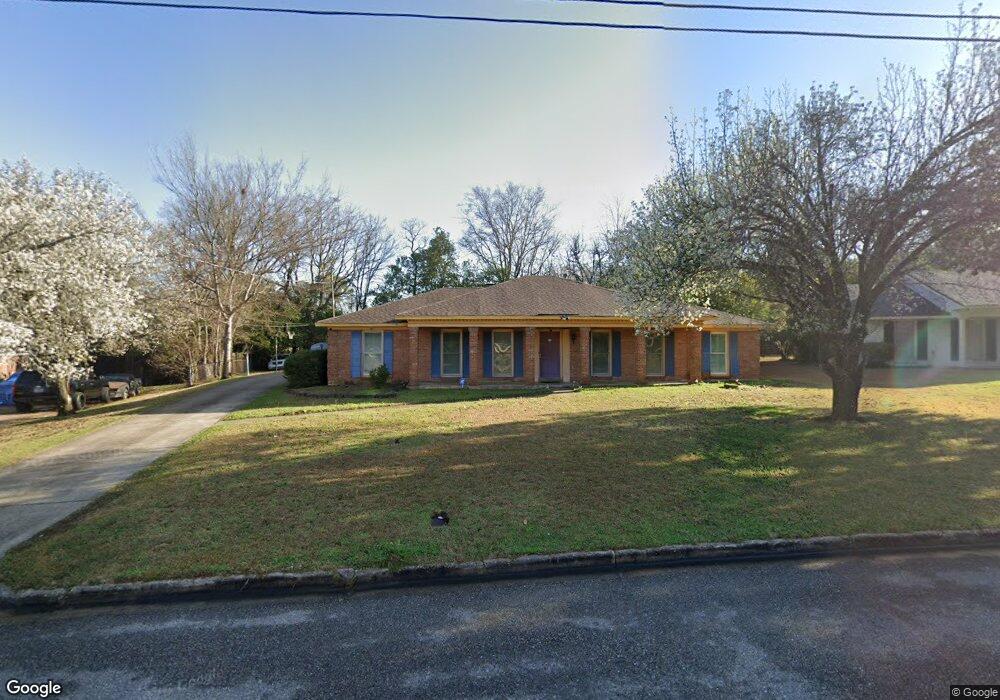
3313 Highridge Ct Montgomery, AL 36111
Estimated Value: $193,000 - $235,000
3
Beds
2
Baths
2,495
Sq Ft
$87/Sq Ft
Est. Value
About This Home
This home is located at 3313 Highridge Ct, Montgomery, AL 36111 and is currently estimated at $216,191, approximately $86 per square foot. 3313 Highridge Ct is a home located in Montgomery County with nearby schools including Dannelly Elementary School, Bellingrath Junior High School, and Johnson Abernathy Graetz (JAG) High School.
Ownership History
Date
Name
Owned For
Owner Type
Purchase Details
Closed on
May 22, 2023
Sold by
Stinson Michael Anthony
Bought by
Graves Reginald L and Robbins Kerrisha
Current Estimated Value
Home Financials for this Owner
Home Financials are based on the most recent Mortgage that was taken out on this home.
Original Mortgage
$147,283
Outstanding Balance
$143,097
Interest Rate
6.27%
Mortgage Type
FHA
Estimated Equity
$73,094
Purchase Details
Closed on
Dec 22, 2011
Sold by
Broadnax Milton and Broadnax Camilla S
Bought by
Stinson Michael Anthony
Home Financials for this Owner
Home Financials are based on the most recent Mortgage that was taken out on this home.
Original Mortgage
$133,039
Interest Rate
3.89%
Mortgage Type
FHA
Purchase Details
Closed on
Jan 31, 2005
Sold by
Broadnax Milton
Bought by
Broadnax Milton and Broadnax Camilla S
Purchase Details
Closed on
Apr 22, 2003
Sold by
Rittenour James and Rittenour Ann
Bought by
Broadnax Milton
Home Financials for this Owner
Home Financials are based on the most recent Mortgage that was taken out on this home.
Original Mortgage
$142,694
Interest Rate
5.81%
Mortgage Type
FHA
Create a Home Valuation Report for This Property
The Home Valuation Report is an in-depth analysis detailing your home's value as well as a comparison with similar homes in the area
Home Values in the Area
Average Home Value in this Area
Purchase History
| Date | Buyer | Sale Price | Title Company |
|---|---|---|---|
| Graves Reginald L | $150,000 | None Listed On Document | |
| Stinson Michael Anthony | -- | None Available | |
| Broadnax Milton | -- | -- | |
| Broadnax Milton | $145,194 | -- |
Source: Public Records
Mortgage History
| Date | Status | Borrower | Loan Amount |
|---|---|---|---|
| Open | Graves Reginald L | $147,283 | |
| Previous Owner | Stinson Michael Anthony | $133,039 | |
| Previous Owner | Broadnax Milton | $142,694 |
Source: Public Records
Tax History Compared to Growth
Tax History
| Year | Tax Paid | Tax Assessment Tax Assessment Total Assessment is a certain percentage of the fair market value that is determined by local assessors to be the total taxable value of land and additions on the property. | Land | Improvement |
|---|---|---|---|---|
| 2025 | $1,060 | $22,690 | $1,750 | $20,940 |
| 2024 | $1,037 | $22,000 | $1,750 | $20,250 |
| 2023 | $1,037 | $18,280 | $1,750 | $16,530 |
| 2022 | $526 | $15,530 | $1,750 | $13,780 |
| 2021 | $464 | $13,840 | $0 | $0 |
| 2020 | $455 | $13,600 | $1,700 | $11,900 |
| 2019 | $442 | $13,240 | $1,700 | $11,540 |
| 2018 | $499 | $13,650 | $1,750 | $11,900 |
| 2017 | $417 | $25,040 | $3,500 | $21,540 |
| 2014 | $398 | $12,020 | $1,750 | $10,270 |
| 2013 | -- | $12,010 | $1,750 | $10,260 |
Source: Public Records
Map
Nearby Homes
- 3740 Fieldcrest Dr
- 2610 Eldington Dr
- 3504 Summerhill Dr
- 3489 Fernway Dr
- 3481 Fernway Dr
- 3505 Falcon Ridge Ct
- 3347 Dresden Dr
- 3566 Edgefield Rd
- 3715 Dresden Ct
- 3055 N Colonial Dr
- 3279 Fieldcrest Dr
- 2722 Oxford Dr
- 3401 Beck Close
- 3212 Capstone Ct
- 3254 Fieldcrest Dr
- 3515 Foxhall Dr
- 2656 Fisk Rd
- 2745 N Wallace Dr
- 2780 S Wallace Dr
- 2455 Price St Unit B
- 3307 Highridge Ct
- 3319 Highridge Ct
- 3320 Fieldcrest Ct
- 3306 Highridge Ct
- 3765 Fieldcrest Dr
- 3314 Fieldcrest Ct
- 3325 Highridge Ct
- 3801 Fieldcrest Dr
- 3757 Fieldcrest Dr
- 3308 Fieldcrest Ct
- 3749 Fieldcrest Dr
- 3312 Highridge Ct
- 3809 Fieldcrest Dr
- 3444 Fieldcrest Ct
- 3318 Highridge Ct
- 3302 Fieldcrest Ct
- 3815 Fieldcrest Dr
- 3327 Fieldcrest Ct
- 3321 Fieldcrest Ct
- 3780 Fieldcrest Dr