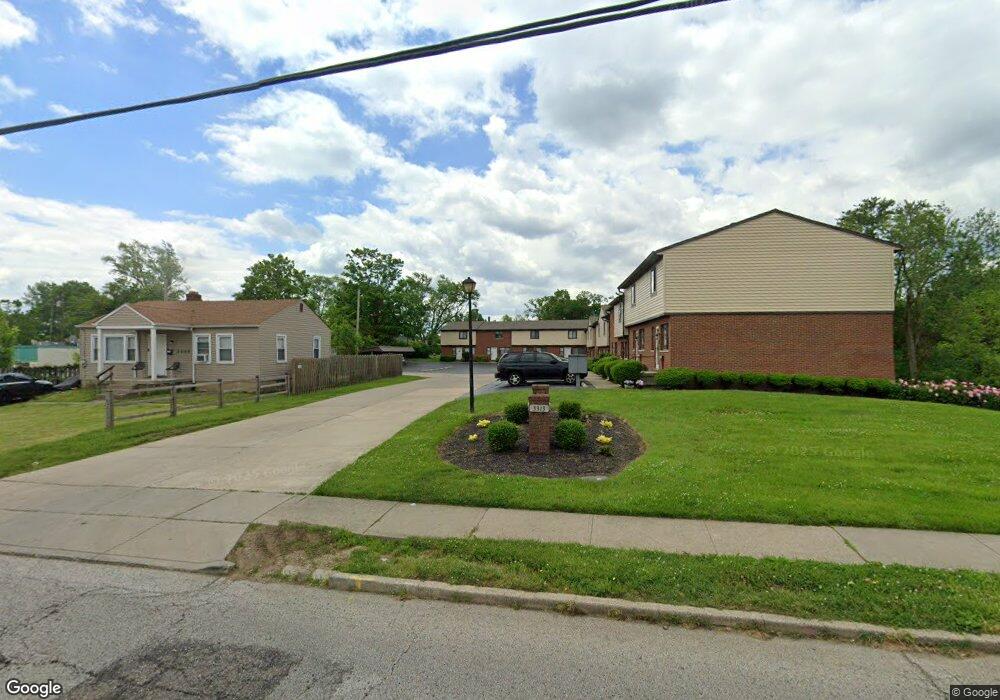
3313 N Bend Rd Unit N Cincinnati, OH 45239
East Monfort Heights NeighborhoodEstimated Value: $148,000 - $160,000
2
Beds
3
Baths
1,383
Sq Ft
$112/Sq Ft
Est. Value
About This Home
This home is located at 3313 N Bend Rd Unit N, Cincinnati, OH 45239 and is currently estimated at $154,735, approximately $111 per square foot. 3313 N Bend Rd Unit N is a home located in Hamilton County with nearby schools including Monfort Heights Elementary School, White Oak Middle School, and Colerain High School.
Ownership History
Date
Name
Owned For
Owner Type
Purchase Details
Closed on
Apr 27, 2017
Sold by
Mongillo Nancy J
Bought by
Lathan Darnel
Current Estimated Value
Home Financials for this Owner
Home Financials are based on the most recent Mortgage that was taken out on this home.
Original Mortgage
$60,019
Outstanding Balance
$49,913
Interest Rate
4.1%
Mortgage Type
New Conventional
Estimated Equity
$104,822
Purchase Details
Closed on
Sep 9, 2005
Sold by
Hoekstra Irma M and Hoekstra Richard N
Bought by
Mongillo Nancy J
Home Financials for this Owner
Home Financials are based on the most recent Mortgage that was taken out on this home.
Original Mortgage
$73,200
Interest Rate
6.01%
Mortgage Type
Fannie Mae Freddie Mac
Purchase Details
Closed on
Mar 22, 2000
Sold by
Hoekstra Irma M
Bought by
Hoekstra Irma M and Hoekstra Richard N
Create a Home Valuation Report for This Property
The Home Valuation Report is an in-depth analysis detailing your home's value as well as a comparison with similar homes in the area
Home Values in the Area
Average Home Value in this Area
Purchase History
| Date | Buyer | Sale Price | Title Company |
|---|---|---|---|
| Lathan Darnel | $61,875 | Mattingly Ford Title | |
| Mongillo Nancy J | $91,500 | None Available | |
| Hoekstra Irma M | -- | -- |
Source: Public Records
Mortgage History
| Date | Status | Borrower | Loan Amount |
|---|---|---|---|
| Open | Lathan Darnel | $60,019 | |
| Previous Owner | Mongillo Nancy J | $73,200 |
Source: Public Records
Tax History Compared to Growth
Tax History
| Year | Tax Paid | Tax Assessment Tax Assessment Total Assessment is a certain percentage of the fair market value that is determined by local assessors to be the total taxable value of land and additions on the property. | Land | Improvement |
|---|---|---|---|---|
| 2024 | $1,890 | $35,592 | $6,370 | $29,222 |
| 2023 | $1,898 | $35,592 | $6,370 | $29,222 |
| 2022 | $1,500 | $22,957 | $4,823 | $18,134 |
| 2021 | $1,376 | $22,957 | $4,823 | $18,134 |
| 2020 | $1,389 | $22,957 | $4,823 | $18,134 |
| 2019 | $1,447 | $21,658 | $4,550 | $17,108 |
| 2018 | $1,289 | $21,658 | $4,550 | $17,108 |
| 2017 | $1,219 | $21,658 | $4,550 | $17,108 |
| 2016 | $1,422 | $24,920 | $4,550 | $20,370 |
| 2015 | $1,435 | $24,920 | $4,550 | $20,370 |
| 2014 | $1,437 | $24,920 | $4,550 | $20,370 |
| 2013 | $1,344 | $24,920 | $4,550 | $20,370 |
Source: Public Records
Map
Nearby Homes
- 3302 N Bend Rd
- 5425 Philloret Dr
- 0 N Bend Rd
- 3198 Sunnyhollow Ln
- 3408 N Bend Rd
- 3176 Sunnyhollow Ln
- 3309 Boca Ln
- 5665 Lauderdale Dr
- 3076 Hoock Ct
- 5741 Lauderdale Dr
- 3072 N Bend Rd
- 3505 W Fork Rd
- 5761 Ocala Ct
- 0 Samver Rd Unit 1841558
- 5607 Samver Rd
- 5538 Silverpoint Dr
- 5610 Samver Rd
- 5737 Kroegermount Dr
- 5607 Leumas Dr
- 5350 Orchardcreek Ct
- 3313 N Bend Rd Unit 3
- 3313 N Bend Rd Unit H
- 3313 N Bend Rd Unit 5
- 3313 N Bend Rd Unit M
- 3313 N Bend Rd Unit A
- 3313 N Bend Rd Unit E
- 3313 N Bend Rd Unit C
- 3313 N Bend Rd Unit D
- 3313 North Bend Unit A
- 3313 North Bend Rd Unit N
- 5479 Clover Leaf Ln
- 3291 N Bend Rd
- 3305 N Bend Rd
- 5463 Clover Leaf Ln
- 5463 Clover Leaf Ln
- 3305 North Bend Rd
- 3325 N Bend Rd Unit L
- 3325 North Bend Rd
- 5453 Clover Leaf Ln
- 5464 Clover Leaf Ln