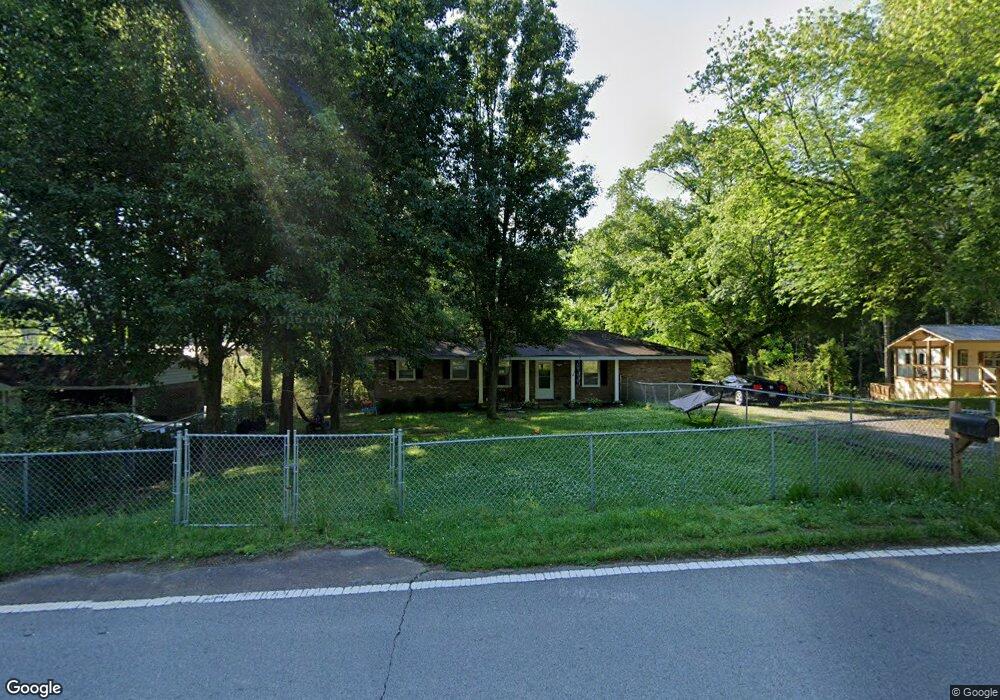
3313 Shady Grove Rd Carrollton, GA 30116
Abilene NeighborhoodEstimated Value: $204,977 - $260,000
3
Beds
3
Baths
1,346
Sq Ft
$169/Sq Ft
Est. Value
About This Home
This home is located at 3313 Shady Grove Rd, Carrollton, GA 30116 and is currently estimated at $227,994, approximately $169 per square foot. 3313 Shady Grove Rd is a home located in Carroll County with nearby schools including Sharp Creek Elementary School, Bay Springs Middle School, and Villa Rica High School.
Ownership History
Date
Name
Owned For
Owner Type
Purchase Details
Closed on
Apr 23, 2021
Sold by
Skinner Denver
Bought by
Skinner Denver and Skinner Kyra Marie
Current Estimated Value
Home Financials for this Owner
Home Financials are based on the most recent Mortgage that was taken out on this home.
Original Mortgage
$183,150
Outstanding Balance
$165,626
Interest Rate
3.1%
Mortgage Type
New Conventional
Estimated Equity
$62,368
Purchase Details
Closed on
Mar 27, 2009
Sold by
Burdette Jeffrey L
Bought by
Burco Pr Llc
Purchase Details
Closed on
Jul 9, 2008
Sold by
Not Provided
Bought by
Burco Mg Llc
Purchase Details
Closed on
May 9, 2008
Sold by
Not Provided
Bought by
Burco Mg Llc
Purchase Details
Closed on
Feb 5, 2008
Sold by
Carri Phillip
Bought by
Homesales Inc
Purchase Details
Closed on
Jul 20, 2001
Sold by
Carri Phillip
Bought by
Carri Phillip and Carri Lesl
Purchase Details
Closed on
Oct 3, 1973
Bought by
Carri Louis Dr
Create a Home Valuation Report for This Property
The Home Valuation Report is an in-depth analysis detailing your home's value as well as a comparison with similar homes in the area
Home Values in the Area
Average Home Value in this Area
Purchase History
| Date | Buyer | Sale Price | Title Company |
|---|---|---|---|
| Skinner Denver | -- | -- | |
| Skinner Denver | $180,000 | -- | |
| Burco Pr Llc | -- | -- | |
| Burco Mg Llc | -- | -- | |
| Burco Mg Llc | $42,000 | -- | |
| Burdette Jeffrey L | -- | -- | |
| Burco Mg Llc | $42,000 | -- | |
| Homesales Inc | $71,995 | -- | |
| Carri Phillip | -- | -- | |
| Carri Phillip | $65,000 | -- | |
| Carri Louis Dr | -- | -- |
Source: Public Records
Mortgage History
| Date | Status | Borrower | Loan Amount |
|---|---|---|---|
| Open | Skinner Denver | $183,150 |
Source: Public Records
Tax History Compared to Growth
Tax History
| Year | Tax Paid | Tax Assessment Tax Assessment Total Assessment is a certain percentage of the fair market value that is determined by local assessors to be the total taxable value of land and additions on the property. | Land | Improvement |
|---|---|---|---|---|
| 2024 | $1,114 | $49,238 | $5,020 | $44,218 |
| 2023 | $1,114 | $44,268 | $4,016 | $40,252 |
| 2022 | $876 | $34,935 | $2,678 | $32,257 |
| 2021 | $766 | $29,887 | $2,142 | $27,745 |
| 2020 | $693 | $26,996 | $1,947 | $25,049 |
| 2019 | $649 | $25,081 | $1,947 | $23,134 |
| 2018 | $587 | $22,353 | $1,820 | $20,533 |
| 2017 | $589 | $22,353 | $1,820 | $20,533 |
| 2016 | $589 | $22,353 | $1,820 | $20,533 |
| 2015 | $544 | $19,452 | $4,000 | $15,452 |
| 2014 | $546 | $19,452 | $4,000 | $15,452 |
Source: Public Records
Map
Nearby Homes
- 3279 Shady Grove Rd
- 59 Tulip Way
- 183 Muse Bridge Rd
- 160 Old Sandhill Rd
- 56 Dahlia Ct
- 10 Deerfield Ln
- 0 Roy Morgan Rd Unit 17.44 ACRES
- 160 & 168 Roy Morgan Rd
- 0 Roy Morgan Rd Unit 7671946
- 133 Deerfield Ln
- 136 Jennifer Ln
- 201 Deerfield Ln
- 436 Laurel Trace
- 415 Paynes Lake Rd
- 0 Paynes Lake Rd Unit 7339831
- 0 Paynes Lake Rd Unit 10254856
- 0 Frashier Rd Unit 7549781
- 0 Frashier Rd Unit 10488685
- 255 Emerald Pointe Dr
- 377 Dock Hyde Rd
- 3341 Shady Grove Rd
- 3319 Shady Grove Rd
- 3302 Shady Grove Rd
- 3386 Shady Grove Rd
- 3350 Shady Grove Rd
- 3354 Shady Grove Rd
- 3338 Shady Grove Rd
- 81 W H Reid Ln
- 3266 Shady Grove Rd
- 3400 Shady Grove Rd
- 3420 Shady Grove Rd
- 3245 Shady Grove Rd
- 3305 Shady Grove Rd
- 106 Peeks Hill Rd
- 3430 Shady Grove Rd
- 1151 Sandhill Shady Grove Rd
- 106 Peek Hill Rd
- 3442 Shady Grove Rd
- 71 W H Reid Ln
- 61 W H Reid Ln