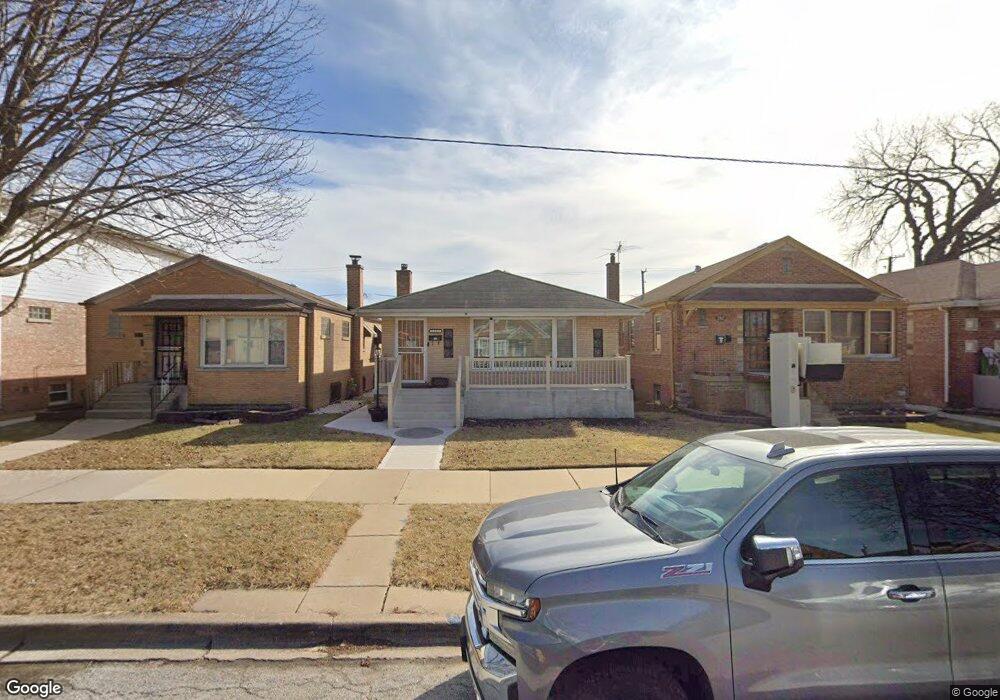
3313 W 84th Place Chicago, IL 60652
Ashburn NeighborhoodEstimated Value: $275,000 - $302,000
2
Beds
2
Baths
1,025
Sq Ft
$281/Sq Ft
Est. Value
About This Home
This home is located at 3313 W 84th Place, Chicago, IL 60652 and is currently estimated at $287,626, approximately $280 per square foot. 3313 W 84th Place is a home located in Cook County with nearby schools including Carroll-Rosenwald Elementary School - Carroll Campus, Bogan Computer Technical High School, and CICS - Wrightwood.
Ownership History
Date
Name
Owned For
Owner Type
Purchase Details
Closed on
Nov 27, 2009
Sold by
The Bank Of New York Trust Company Na
Bought by
Polk Franklin and Polk Yolanda
Current Estimated Value
Home Financials for this Owner
Home Financials are based on the most recent Mortgage that was taken out on this home.
Original Mortgage
$117,826
Interest Rate
5.87%
Mortgage Type
FHA
Purchase Details
Closed on
May 12, 2008
Sold by
Wells Lawrence D and Wells Lawrence
Bought by
The Bank Of New York Trust Co Na and Jpmorgan Chase Bank Na
Purchase Details
Closed on
Dec 2, 2004
Sold by
Steiner Dorothy M and Steiner Glodo Dorothy M
Bought by
Wells Lawrence D
Home Financials for this Owner
Home Financials are based on the most recent Mortgage that was taken out on this home.
Original Mortgage
$180,000
Interest Rate
6.25%
Mortgage Type
Unknown
Purchase Details
Closed on
Dec 29, 1994
Sold by
Steiner Mary E and Steiner Patricia H
Bought by
Steiner Dorothy M
Create a Home Valuation Report for This Property
The Home Valuation Report is an in-depth analysis detailing your home's value as well as a comparison with similar homes in the area
Home Values in the Area
Average Home Value in this Area
Purchase History
| Date | Buyer | Sale Price | Title Company |
|---|---|---|---|
| Polk Franklin | $120,000 | First American Title | |
| The Bank Of New York Trust Co Na | -- | None Available | |
| Wells Lawrence D | $225,000 | Pntn | |
| Steiner Dorothy M | -- | -- |
Source: Public Records
Mortgage History
| Date | Status | Borrower | Loan Amount |
|---|---|---|---|
| Previous Owner | Polk Franklin | $117,826 | |
| Previous Owner | Wells Lawrence D | $180,000 | |
| Closed | Wells Lawrence D | $45,000 |
Source: Public Records
Tax History Compared to Growth
Tax History
| Year | Tax Paid | Tax Assessment Tax Assessment Total Assessment is a certain percentage of the fair market value that is determined by local assessors to be the total taxable value of land and additions on the property. | Land | Improvement |
|---|---|---|---|---|
| 2024 | $3,121 | $20,000 | $2,400 | $17,600 |
| 2023 | $3,022 | $18,000 | $3,200 | $14,800 |
| 2022 | $3,022 | $18,000 | $3,200 | $14,800 |
| 2021 | $2,973 | $18,000 | $3,200 | $14,800 |
| 2020 | $2,633 | $14,818 | $3,200 | $11,618 |
| 2019 | $2,641 | $16,465 | $3,200 | $13,265 |
| 2018 | $2,596 | $16,465 | $3,200 | $13,265 |
| 2017 | $2,340 | $14,144 | $2,800 | $11,344 |
| 2016 | $2,354 | $14,144 | $2,800 | $11,344 |
| 2015 | $2,131 | $14,144 | $2,800 | $11,344 |
| 2014 | $2,058 | $13,552 | $2,600 | $10,952 |
| 2013 | $2,007 | $13,552 | $2,600 | $10,952 |
Source: Public Records
Map
Nearby Homes
- 3237 W 83rd Place
- 3442 W 84th St
- 3101 W 87th St
- 8223 S Sawyer Ave
- 3030 W 85th St
- 8242 S Albany Ave
- 8738 S Troy Ave
- 8230 S Albany Ave
- 3158 W 88th St Unit 103
- 8753 S Troy Ave
- 8118 S Spaulding Ave
- 3011 W 87th St
- 3614 W 86th Place
- 3630 W 86th Place
- 8701 S Sacramento Ave Unit 2NW
- 8821 S Troy Ave
- 3631 W 86th Place
- 8834 S Albany Ave
- 8053 S Kedzie Ave
- 8033 S Kedzie Ave
- 3317 W 84th Place
- 3311 W 84th Place
- 3321 W 84th Place
- 3307 W 84th Place
- 3303 W 84th Place
- 3329 W 84th Place
- 3301 W 84th Place
- 3314 W 85th St
- 3310 W 85th St
- 3318 W 85th St
- 3308 W 85th St
- 3320 W 85th St
- 3331 W 84th Place
- 3304 W 85th St
- 3322 W 85th St
- 3326 W 85th St
- 3300 W 85th St
- 3314 W 84th Place
- 3310 W 84th Place
- 3316 W 84th Place