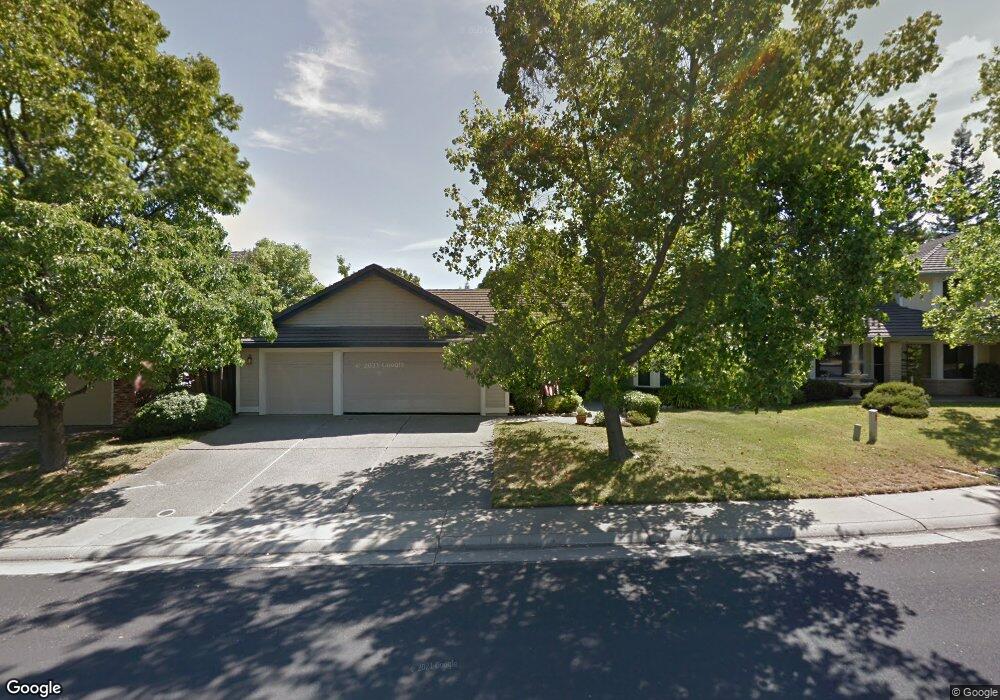
3314 Southwind Cir Rocklin, CA 95765
Sunset Whitney NeighborhoodEstimated Value: $640,685 - $778,000
4
Beds
2
Baths
2,004
Sq Ft
$347/Sq Ft
Est. Value
About This Home
This home is located at 3314 Southwind Cir, Rocklin, CA 95765 and is currently estimated at $695,671, approximately $347 per square foot. 3314 Southwind Cir is a home located in Placer County with nearby schools including Cobblestone Elementary School, Granite Oaks Middle, and Rocklin High.
Ownership History
Date
Name
Owned For
Owner Type
Purchase Details
Closed on
May 4, 2009
Sold by
Walls N Kathryn S
Bought by
Chaffin Terence D
Current Estimated Value
Home Financials for this Owner
Home Financials are based on the most recent Mortgage that was taken out on this home.
Original Mortgage
$149,300
Outstanding Balance
$93,618
Interest Rate
4.71%
Mortgage Type
New Conventional
Estimated Equity
$602,053
Purchase Details
Closed on
Sep 30, 2005
Sold by
Walls N Kathryn S
Bought by
Walls N Kathryn S
Purchase Details
Closed on
Jul 15, 1998
Sold by
Cameron Craig A and Cameron Janie D
Bought by
Chaffin Terence D
Home Financials for this Owner
Home Financials are based on the most recent Mortgage that was taken out on this home.
Original Mortgage
$179,800
Interest Rate
7%
Purchase Details
Closed on
May 10, 1995
Sold by
Southfork Partnership
Bought by
Cameron Craig A
Home Financials for this Owner
Home Financials are based on the most recent Mortgage that was taken out on this home.
Original Mortgage
$212,300
Interest Rate
8.51%
Create a Home Valuation Report for This Property
The Home Valuation Report is an in-depth analysis detailing your home's value as well as a comparison with similar homes in the area
Home Values in the Area
Average Home Value in this Area
Purchase History
| Date | Buyer | Sale Price | Title Company |
|---|---|---|---|
| Chaffin Terence D | -- | First American Title Ins Co | |
| Walls N Kathryn S | -- | -- | |
| Chaffin Terence D | -- | -- | |
| Chaffin Terence D | $200,000 | First American Title Ins Co | |
| Cameron Craig A | $223,500 | Chicago Title Company |
Source: Public Records
Mortgage History
| Date | Status | Borrower | Loan Amount |
|---|---|---|---|
| Open | Chaffin Terence D | $149,300 | |
| Closed | Chaffin Terence D | $179,800 | |
| Previous Owner | Cameron Craig A | $212,300 |
Source: Public Records
Tax History Compared to Growth
Tax History
| Year | Tax Paid | Tax Assessment Tax Assessment Total Assessment is a certain percentage of the fair market value that is determined by local assessors to be the total taxable value of land and additions on the property. | Land | Improvement |
|---|---|---|---|---|
| 2025 | $3,402 | $313,519 | $125,404 | $188,115 |
| 2023 | $3,402 | $301,347 | $120,536 | $180,811 |
| 2022 | $3,291 | $295,439 | $118,173 | $177,266 |
| 2021 | $3,255 | $289,647 | $115,856 | $173,791 |
| 2020 | $3,249 | $286,678 | $114,669 | $172,009 |
| 2019 | $3,204 | $281,058 | $112,421 | $168,637 |
| 2018 | $3,121 | $275,548 | $110,217 | $165,331 |
| 2017 | $3,123 | $270,146 | $108,056 | $162,090 |
| 2016 | $3,034 | $264,850 | $105,938 | $158,912 |
| 2015 | $2,996 | $260,872 | $104,347 | $156,525 |
| 2014 | $2,943 | $255,762 | $102,303 | $153,459 |
Source: Public Records
Map
Nearby Homes
- 3203 Thistle Ct
- 3120 Aaron Dr
- 5247 Silver Peak Ln
- 4270 Midas Ave
- 5406 Butte Cir
- 3425 Cimmeron Ct
- 3090 Cerro Cir
- 3563 Creekwood Dr
- 3962 Rawhide Rd
- 3204 Camelot Dr
- 5601 Grand View Ct
- 1816 Illinois Way Unit 48
- 4834 Blaydon Rd
- 0 Skyline Dr Unit 225004715
- 5608 Grand View Ct
- 5248 Bay St
- 3265 Argonaut Ave
- 3165 Argonaut Ave
- 5362 Delta Dr
- 5217 Del Vista Way
- 3316 Southwind Cir
- 3312 Southwind Cir
- 5105 Wedgewood Way
- 5103 Wedgewood Way
- 3307 Southwind Cir
- 5107 Wedgewood Way
- 3318 Southwind Cir
- 3310 Southwind Cir
- 5101 Wedgewood Way
- 3321 Southwind Cir
- 5109 Wedgewood Way
- 3308 Southwind Cir
- 3305 Southwind Cir
- 3320 Southwind Cir
- 5111 Wedgewood Way
- 3323 Southwind Cir
- 3134 Aaron Dr
- 3306 Southwind Cir
- 3322 Southwind Cir
- 3200 Burlwood Ct