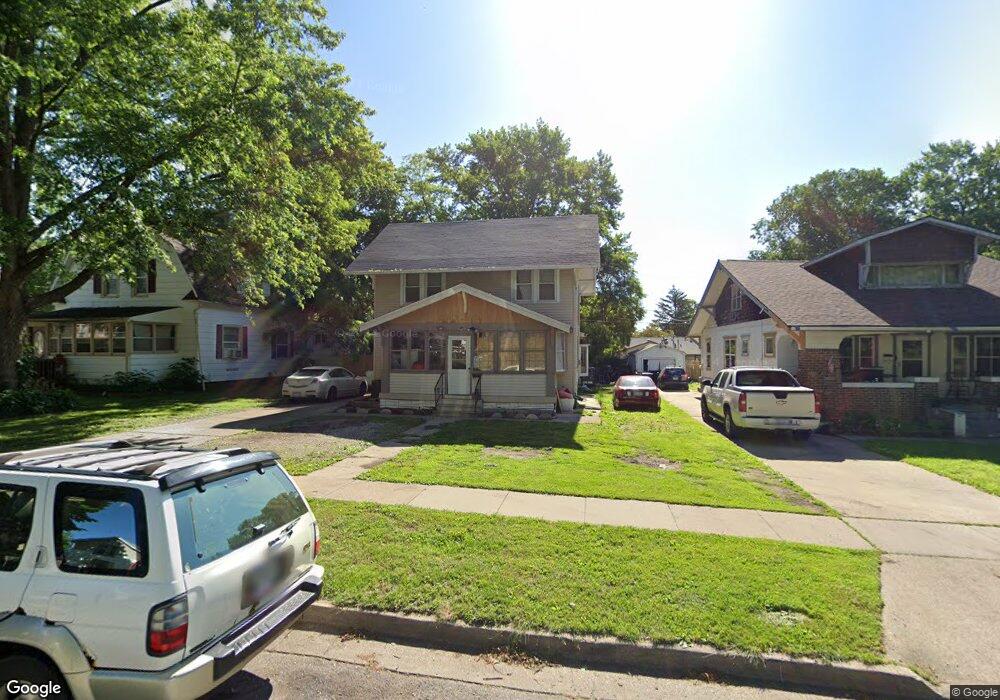
3315 4th St Des Moines, IA 50313
Highland Park NeighborhoodEstimated Value: $178,000 - $214,000
3
Beds
1
Bath
1,618
Sq Ft
$122/Sq Ft
Est. Value
About This Home
This home is located at 3315 4th St, Des Moines, IA 50313 and is currently estimated at $197,851, approximately $122 per square foot. 3315 4th St is a home located in Polk County with nearby schools including Oak Park Elementary School, Harding Middle School, and North High School.
Ownership History
Date
Name
Owned For
Owner Type
Purchase Details
Closed on
Jul 3, 2025
Sold by
So Phannaren
Bought by
So Phannaren and Sivongsay Khamphat
Current Estimated Value
Home Financials for this Owner
Home Financials are based on the most recent Mortgage that was taken out on this home.
Original Mortgage
$112,000
Outstanding Balance
$111,523
Interest Rate
6.86%
Mortgage Type
New Conventional
Estimated Equity
$86,328
Purchase Details
Closed on
Jun 16, 2025
Sold by
Kuangvanh Chanh and Kuangvanh Boualaphanh
Bought by
So Phannaren
Home Financials for this Owner
Home Financials are based on the most recent Mortgage that was taken out on this home.
Original Mortgage
$112,000
Outstanding Balance
$111,523
Interest Rate
6.86%
Mortgage Type
New Conventional
Estimated Equity
$86,328
Purchase Details
Closed on
Dec 15, 2017
Sold by
Cantract Exchange Corp
Bought by
Kaungvanh Chanh
Home Financials for this Owner
Home Financials are based on the most recent Mortgage that was taken out on this home.
Original Mortgage
$58,000
Interest Rate
3.94%
Mortgage Type
New Conventional
Purchase Details
Closed on
Sep 7, 2017
Sold by
Polk County Sheriff
Bought by
Contract Exchange Corp
Purchase Details
Closed on
Sep 24, 2003
Sold by
Kvengloundara Hay and Lovan One Lo
Bought by
Lovan Sammy H and Lovan One Lo
Home Financials for this Owner
Home Financials are based on the most recent Mortgage that was taken out on this home.
Original Mortgage
$53,000
Interest Rate
6.33%
Mortgage Type
Purchase Money Mortgage
Create a Home Valuation Report for This Property
The Home Valuation Report is an in-depth analysis detailing your home's value as well as a comparison with similar homes in the area
Home Values in the Area
Average Home Value in this Area
Purchase History
| Date | Buyer | Sale Price | Title Company |
|---|---|---|---|
| So Phannaren | -- | None Listed On Document | |
| So Phannaren | -- | None Listed On Document | |
| So Phannaren | $140,000 | None Listed On Document | |
| So Phannaren | $140,000 | None Listed On Document | |
| Kaungvanh Chanh | $72,500 | None Available | |
| Contract Exchange Corp | $53,639 | -- | |
| Lovan Sammy H | -- | -- |
Source: Public Records
Mortgage History
| Date | Status | Borrower | Loan Amount |
|---|---|---|---|
| Open | So Phannaren | $112,000 | |
| Closed | So Phannaren | $112,000 | |
| Previous Owner | Kaungvanh Chanh | $58,000 | |
| Previous Owner | Lovan Sammy H | $53,000 |
Source: Public Records
Tax History Compared to Growth
Tax History
| Year | Tax Paid | Tax Assessment Tax Assessment Total Assessment is a certain percentage of the fair market value that is determined by local assessors to be the total taxable value of land and additions on the property. | Land | Improvement |
|---|---|---|---|---|
| 2025 | $3,726 | $218,000 | $29,100 | $188,900 |
| 2024 | $3,726 | $189,400 | $25,200 | $164,200 |
| 2023 | $3,622 | $189,400 | $25,200 | $164,200 |
| 2022 | $3,594 | $153,700 | $21,300 | $132,400 |
| 2021 | $3,398 | $153,700 | $21,300 | $132,400 |
| 2020 | $3,530 | $136,200 | $19,100 | $117,100 |
| 2019 | $3,362 | $136,200 | $19,100 | $117,100 |
| 2018 | $3,096 | $125,100 | $17,400 | $107,700 |
| 2017 | $2,826 | $125,100 | $17,400 | $107,700 |
| 2016 | $2,748 | $113,000 | $15,600 | $97,400 |
| 2015 | $2,748 | $113,000 | $15,600 | $97,400 |
| 2014 | $2,494 | $106,300 | $14,400 | $91,900 |
Source: Public Records
Map
Nearby Homes