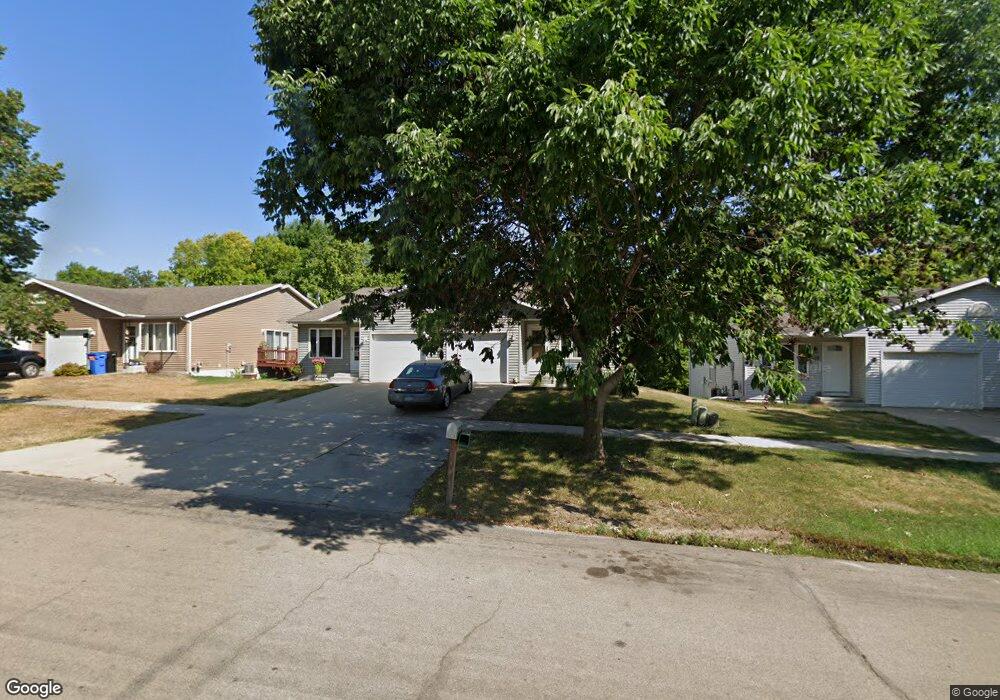
3315 7th St NW Rochester, MN 55901
Estimated Value: $228,632 - $250,000
3
Beds
2
Baths
1,032
Sq Ft
$231/Sq Ft
Est. Value
About This Home
This home is located at 3315 7th St NW, Rochester, MN 55901 and is currently estimated at $238,658, approximately $231 per square foot. 3315 7th St NW is a home located in Olmsted County with nearby schools including Bishop Elementary School, John Adams Middle School, and John Marshall Senior High School.
Ownership History
Date
Name
Owned For
Owner Type
Purchase Details
Closed on
Oct 21, 2020
Sold by
Westphal Susan Denise and Westphal Susan D
Bought by
Westphal Susan Denise and Westphal Cheri Lynn
Current Estimated Value
Home Financials for this Owner
Home Financials are based on the most recent Mortgage that was taken out on this home.
Original Mortgage
$138,380
Outstanding Balance
$123,082
Interest Rate
2.9%
Mortgage Type
FHA
Estimated Equity
$115,576
Purchase Details
Closed on
Jul 27, 2006
Sold by
Burfeind Carl C and Burfeind Evelyn M
Bought by
Westphal Susan D
Home Financials for this Owner
Home Financials are based on the most recent Mortgage that was taken out on this home.
Original Mortgage
$120,800
Interest Rate
6.78%
Mortgage Type
New Conventional
Create a Home Valuation Report for This Property
The Home Valuation Report is an in-depth analysis detailing your home's value as well as a comparison with similar homes in the area
Home Values in the Area
Average Home Value in this Area
Purchase History
| Date | Buyer | Sale Price | Title Company |
|---|---|---|---|
| Westphal Susan Denise | -- | None Available | |
| Westphal Susan Denise | -- | None Available | |
| Westphal Susan D | $151,000 | Thompson Title & Escrow | |
| Westphal Susan D | $151,000 | Thompson Title |
Source: Public Records
Mortgage History
| Date | Status | Borrower | Loan Amount |
|---|---|---|---|
| Open | Westphal Susan Denise | $138,380 | |
| Closed | Westphal Susan Denise | $138,380 | |
| Previous Owner | Westphal Susan D | $120,800 |
Source: Public Records
Tax History Compared to Growth
Tax History
| Year | Tax Paid | Tax Assessment Tax Assessment Total Assessment is a certain percentage of the fair market value that is determined by local assessors to be the total taxable value of land and additions on the property. | Land | Improvement |
|---|---|---|---|---|
| 2024 | $2,852 | $225,400 | $30,000 | $195,400 |
| 2023 | $2,594 | $220,900 | $30,000 | $190,900 |
| 2022 | $2,366 | $202,100 | $30,000 | $172,100 |
| 2021 | $2,230 | $189,400 | $30,000 | $159,400 |
| 2020 | $2,158 | $179,800 | $30,000 | $149,800 |
| 2019 | $1,772 | $169,100 | $30,000 | $139,100 |
| 2018 | $1,658 | $144,500 | $20,000 | $124,500 |
| 2017 | $1,586 | $141,000 | $20,000 | $121,000 |
| 2016 | $1,538 | $104,500 | $16,100 | $88,400 |
| 2015 | $1,448 | $99,300 | $15,900 | $83,400 |
| 2014 | $1,396 | $100,500 | $15,900 | $84,600 |
| 2012 | -- | $99,600 | $15,873 | $83,727 |
Source: Public Records
Map
Nearby Homes
- 3415 7th St NW
- 468 Panorama Cir NW
- 670 Panorama Cir NW
- 3415 Lake St NW
- 3740 8th St NW
- 3909 3rd St NW
- 4013 3rd St NW
- 4054 4th Place NW
- 4036 3rd St NW
- 4339 Manor Park Dr NW
- 3046 Jeremiah Ln NW
- 2223 Valleyhigh Dr NW
- 2106 Valleyhigh Dr NW Unit A202
- 360 Wimbledon Hills Dr SW
- 2032 Valleyhigh Dr NW
- 2921 4th St SW
- 2010 16 1 2 St NW
- 2858 25th St NW
- 2408 22nd St NW
- 2804 25th St NW
- 3317 7th St NW
- 3323 7th St NW
- 3309 7th St NW
- 3325 7th St NW
- 3305 7th St NW
- 3327 7th St NW
- 3329 7th St NW
- 3303 7th St NW
- 722 34th Avenue Ct NW
- 802 802 34th Avenue-Court-nw
- 802 34th Avenue Ct NW
- 714 34th Avenue Ct NW
- 810 34th Avenue Ct NW
- 3314 7th St NW
- 3308 7th St NW
- 3320 7th St NW
- 706 34th Avenue Ct NW
- 3302 7th St NW
- 3326 7th St NW
- 3296 7th St NW