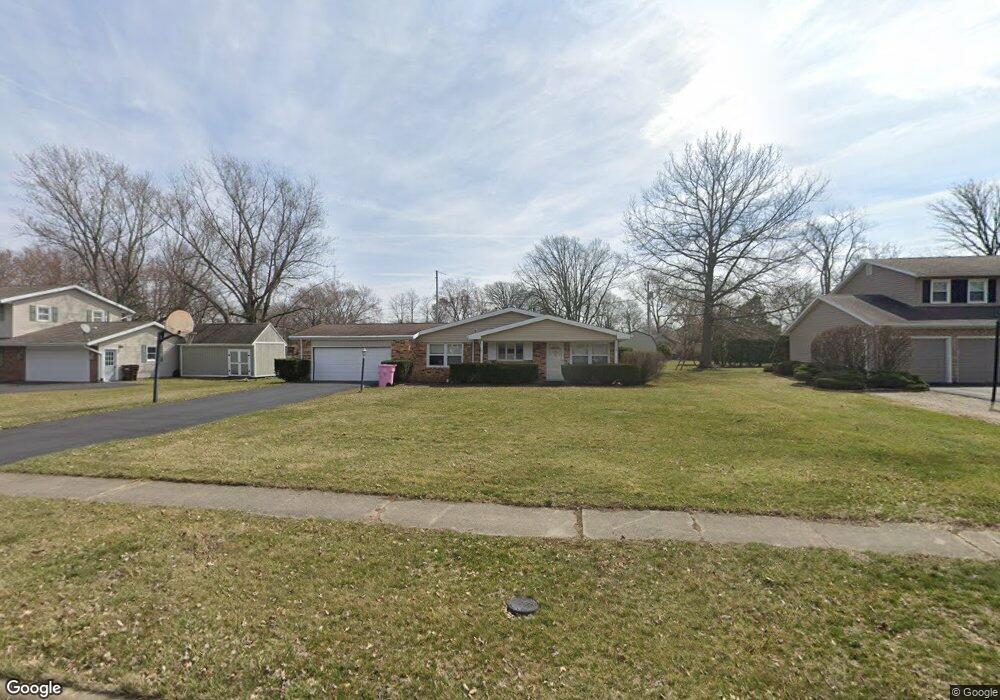
3315 Ridgeview Dr Findlay, OH 45840
Estimated Value: $234,000 - $260,000
3
Beds
2
Baths
1,558
Sq Ft
$160/Sq Ft
Est. Value
About This Home
This home is located at 3315 Ridgeview Dr, Findlay, OH 45840 and is currently estimated at $249,322, approximately $160 per square foot. 3315 Ridgeview Dr is a home located in Hancock County with nearby schools including Bigelow Hill Elementary School, Northview Elementary School, and Glenwood Middle School.
Ownership History
Date
Name
Owned For
Owner Type
Purchase Details
Closed on
Jun 16, 2016
Sold by
Moore Harold J and Moore Joanne S
Bought by
Tomlins Thomas
Current Estimated Value
Home Financials for this Owner
Home Financials are based on the most recent Mortgage that was taken out on this home.
Original Mortgage
$100,000
Outstanding Balance
$79,373
Interest Rate
3.57%
Mortgage Type
New Conventional
Estimated Equity
$169,949
Purchase Details
Closed on
Aug 23, 2002
Sold by
Adams Carl E
Bought by
Moore Harold J and Moore Joanne S
Purchase Details
Closed on
Jul 15, 1997
Sold by
Ufheil Irene
Bought by
Adams Carl and Adams Dolores
Home Financials for this Owner
Home Financials are based on the most recent Mortgage that was taken out on this home.
Original Mortgage
$80,850
Interest Rate
8%
Mortgage Type
New Conventional
Purchase Details
Closed on
Jul 22, 1986
Bought by
Ufheil Irene
Create a Home Valuation Report for This Property
The Home Valuation Report is an in-depth analysis detailing your home's value as well as a comparison with similar homes in the area
Home Values in the Area
Average Home Value in this Area
Purchase History
| Date | Buyer | Sale Price | Title Company |
|---|---|---|---|
| Tomlins Thomas | $130,500 | Assured Title Agency | |
| Moore Harold J | $137,500 | -- | |
| Adams Carl | $115,500 | -- | |
| Ufheil Irene | -- | -- |
Source: Public Records
Mortgage History
| Date | Status | Borrower | Loan Amount |
|---|---|---|---|
| Open | Tomlins Thomas | $100,000 | |
| Previous Owner | Adams Carl | $80,850 |
Source: Public Records
Tax History Compared to Growth
Tax History
| Year | Tax Paid | Tax Assessment Tax Assessment Total Assessment is a certain percentage of the fair market value that is determined by local assessors to be the total taxable value of land and additions on the property. | Land | Improvement |
|---|---|---|---|---|
| 2024 | $2,265 | $63,740 | $10,320 | $53,420 |
| 2023 | $2,268 | $63,740 | $10,320 | $53,420 |
| 2022 | $2,260 | $63,740 | $10,320 | $53,420 |
| 2021 | $2,081 | $51,120 | $10,330 | $40,790 |
| 2020 | $2,081 | $51,120 | $10,330 | $40,790 |
| 2019 | $2,039 | $51,120 | $10,330 | $40,790 |
| 2018 | $1,805 | $41,530 | $7,950 | $33,580 |
| 2017 | $903 | $41,530 | $7,950 | $33,580 |
| 2016 | $1,783 | $41,530 | $7,950 | $33,580 |
| 2015 | $1,627 | $45,970 | $7,950 | $38,020 |
| 2014 | $1,628 | $45,970 | $7,950 | $38,020 |
| 2012 | $1,639 | $45,970 | $7,950 | $38,020 |
Source: Public Records
Map
Nearby Homes
- 3300 Crosshill Dr
- 506 Hillcrest Ave
- 615 Hillcrest Ave
- 126 Hillcrest Ave
- 3239 N Main St
- 3315 Terrace Ln
- 1310 Muirfield Dr
- 128 Harrington Ave
- 0 Township Highway 99
- 12325 Township Highway 99
- 231 Tioga Ave
- 933 Laurel Ln
- 0 County Road 220 Unit 6111396
- 0 County Road 220 Unit 6111394
- 0 County Road 220 Unit 6111400
- 3018 Gleneagle Dr
- 643 Edith Ave
- 304 Prentiss Ave
- 232 Prentiss Ave
- 1934 Geffs Ave
- 3311 Ridgeview Dr
- 3321 Ridgeview Dr
- 3222 Norcrest St
- 3214 Norcrest St
- 3307 Ridgeview Dr
- 3316 Ridgeview Dr
- 3312 Ridgeview Dr
- 3208 Norcrest St
- 3322 Ridgeview Dr
- 3306 Ridgeview Dr
- 3301 Ridgeview Dr
- 3325 Ridgeview Dr
- 3227 Norcrest St
- 3200 Norcrest St
- 3310 Norcrest St
- 3300 Ridgeview Dr
- 3235 Norcrest St
- 3215 Norcrest St
- 3225 Ridgeview Dr
- 3326 Ridgeview Dr