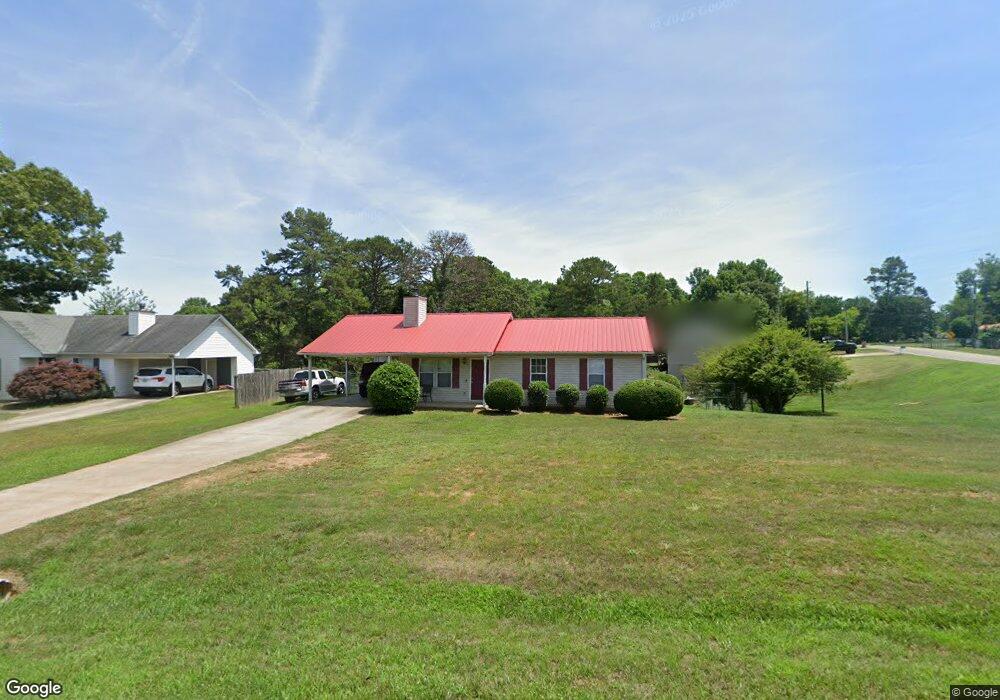
3315 Shuler Rd Gainesville, GA 30506
Estimated Value: $231,000 - $287,260
3
Beds
2
Baths
1,138
Sq Ft
$234/Sq Ft
Est. Value
About This Home
This home is located at 3315 Shuler Rd, Gainesville, GA 30506 and is currently estimated at $266,565, approximately $234 per square foot. 3315 Shuler Rd is a home located in Hall County with nearby schools including Sardis Elementary School, Cartersville Primary School, and Chestatee Middle School.
Ownership History
Date
Name
Owned For
Owner Type
Purchase Details
Closed on
May 1, 2017
Sold by
Long Michael G
Bought by
Grey Brenda C and Grey Glenn G
Current Estimated Value
Home Financials for this Owner
Home Financials are based on the most recent Mortgage that was taken out on this home.
Original Mortgage
$98,100
Outstanding Balance
$81,672
Interest Rate
4.14%
Mortgage Type
New Conventional
Estimated Equity
$184,893
Purchase Details
Closed on
Oct 25, 2013
Sold by
Mcgehee Shirley
Bought by
Long Michael G
Purchase Details
Closed on
Jul 13, 2011
Sold by
Taylor Clarence T
Bought by
Mcgehee Shirley S
Purchase Details
Closed on
Oct 9, 1996
Sold by
Martin Jon A Catherine M
Bought by
Cates Bert W
Purchase Details
Closed on
Jun 1, 1994
Create a Home Valuation Report for This Property
The Home Valuation Report is an in-depth analysis detailing your home's value as well as a comparison with similar homes in the area
Home Values in the Area
Average Home Value in this Area
Purchase History
| Date | Buyer | Sale Price | Title Company |
|---|---|---|---|
| Grey Brenda C | $109,000 | -- | |
| Long Michael G | -- | -- | |
| Mcgehee Shirley S | $45,000 | -- | |
| Cates Bert W | $78,000 | -- | |
| -- | $68,500 | -- |
Source: Public Records
Mortgage History
| Date | Status | Borrower | Loan Amount |
|---|---|---|---|
| Open | Grey Brenda C | $98,100 | |
| Closed | Cates Bert W | $0 |
Source: Public Records
Tax History Compared to Growth
Tax History
| Year | Tax Paid | Tax Assessment Tax Assessment Total Assessment is a certain percentage of the fair market value that is determined by local assessors to be the total taxable value of land and additions on the property. | Land | Improvement |
|---|---|---|---|---|
| 2024 | $2,160 | $84,520 | $12,960 | $71,560 |
| 2023 | $2,160 | $84,520 | $12,960 | $71,560 |
| 2022 | $1,914 | $71,480 | $16,200 | $55,280 |
| 2021 | $1,392 | $50,240 | $5,640 | $44,600 |
| 2020 | $1,369 | $47,920 | $5,640 | $42,280 |
| 2019 | $1,376 | $47,760 | $5,640 | $42,120 |
| 2018 | $1,237 | $41,280 | $5,640 | $35,640 |
| 2017 | $937 | $30,960 | $4,760 | $26,200 |
| 2016 | $937 | $31,720 | $5,560 | $26,160 |
| 2015 | $741 | $24,323 | $3,480 | $20,843 |
| 2014 | $741 | $24,323 | $3,480 | $20,843 |
Source: Public Records
Map
Nearby Homes
- 3550 Dockside Shores Dr
- 2903 Lynncliff Dr
- 3514 Dockside Shores Dr
- 3543 Dockside Shores Dr
- 3551 Dockside Shores Dr
- 2527 Venture Cir
- 3411 Lake Ridge Place
- 3545 Cub Cir
- 3443 Dockside Shores Dr
- 3416 Dockside Shores Dr
- 2496 Venture Dr
- 3715 Cameron Cir
- 3641 Bert Dr
- 2520 Dawsonville Hwy
- 3645 Bert Dr
- 2231 Lake Ranch Ct
- 3568 Old Duckett Mill Rd
- 2237 Lake Ranch Ct
- 2245 Sidney Dr
- 3313 Shuler Rd
- 3207 Fork Rd
- 3401 Shuler Rd
- 3215 Fork Rd
- 3307 Shuler Rd
- 3121 Fork Rd
- 3310 Shuler Rd
- 3122 Fork Rd
- 3304 Russell Dr
- 3219 Fork Rd
- 3306 Shuler Rd
- 0 Russell Dr Unit LOT 5B 3038221
- 0 Russell Dr Unit LOT 5A 3038211
- 0 Russell Dr Unit LOT 4B 3038206
- 0 Russell Dr Unit LOT 4A 3038204
- 0 Russell Dr Unit 8704909
- 0 Russell Dr Unit 8845717
- 3216 Fork Rd
- 3115 Fork Rd
- 3118 Fork Rd