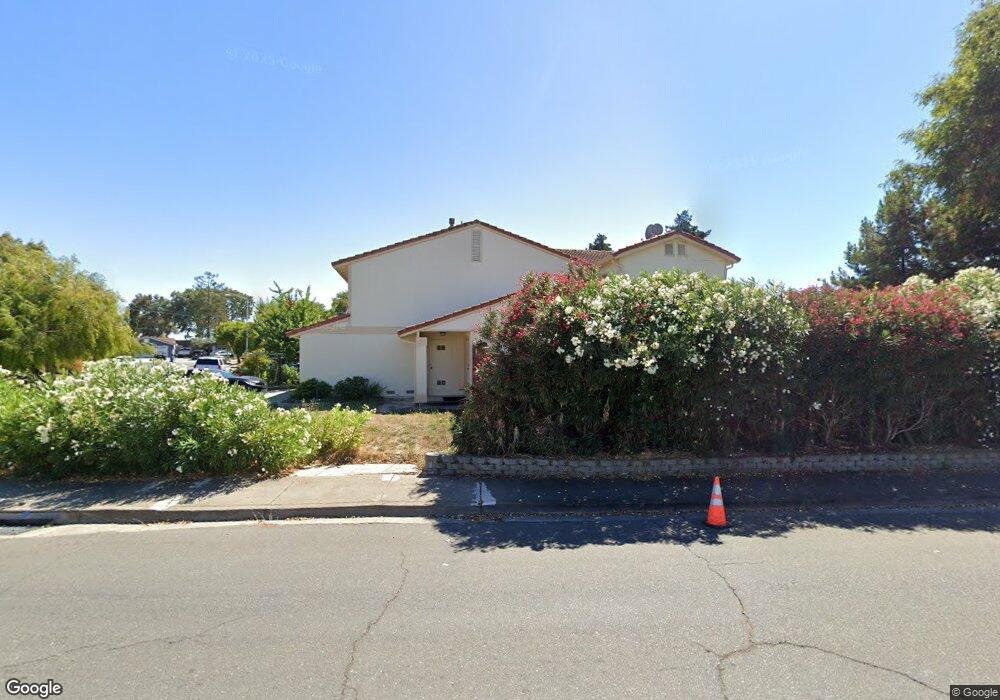
33156 Mckeown Ct Union City, CA 94587
Alvarado NeighborhoodEstimated Value: $1,301,031 - $1,722,000
3
Beds
--
Bath
1,335
Sq Ft
$1,151/Sq Ft
Est. Value
About This Home
This home is located at 33156 Mckeown Ct, Union City, CA 94587 and is currently estimated at $1,536,758, approximately $1,151 per square foot. 33156 Mckeown Ct is a home located in Alameda County with nearby schools including Pioneer Elementary School, Itliong-Vera Cruz, and James Logan High School.
Ownership History
Date
Name
Owned For
Owner Type
Purchase Details
Closed on
Apr 7, 2020
Sold by
Chang Suk Hwi and Chang Byung Sook
Bought by
Sook Suk Hwi and Chang Byung Sook
Current Estimated Value
Home Financials for this Owner
Home Financials are based on the most recent Mortgage that was taken out on this home.
Original Mortgage
$505,000
Outstanding Balance
$445,661
Interest Rate
3.2%
Mortgage Type
New Conventional
Estimated Equity
$1,091,097
Purchase Details
Closed on
Nov 9, 2015
Sold by
Chang Byung Sook
Bought by
The Byung S Chang Revocable Trust
Purchase Details
Closed on
Oct 2, 2015
Sold by
Chang Suk Hwi and Chang Byung Sook
Bought by
Chang Byung Sook
Purchase Details
Closed on
May 26, 1999
Sold by
Mendoza Jose S and Mendoza Rufina R
Bought by
Chang Suk Hwi and Chang Byung Sook
Home Financials for this Owner
Home Financials are based on the most recent Mortgage that was taken out on this home.
Original Mortgage
$310,500
Interest Rate
6.84%
Create a Home Valuation Report for This Property
The Home Valuation Report is an in-depth analysis detailing your home's value as well as a comparison with similar homes in the area
Home Values in the Area
Average Home Value in this Area
Purchase History
| Date | Buyer | Sale Price | Title Company |
|---|---|---|---|
| Sook Suk Hwi | -- | Calatlantic Title Inc | |
| The Byung S Chang Revocable Trust | -- | None Available | |
| Chang Byung Sook | -- | None Available | |
| Chang Suk Hwi | $345,000 | Fidelity National Title |
Source: Public Records
Mortgage History
| Date | Status | Borrower | Loan Amount |
|---|---|---|---|
| Open | Sook Suk Hwi | $505,000 | |
| Closed | Chang Suk Hwi | $310,500 |
Source: Public Records
Tax History Compared to Growth
Tax History
| Year | Tax Paid | Tax Assessment Tax Assessment Total Assessment is a certain percentage of the fair market value that is determined by local assessors to be the total taxable value of land and additions on the property. | Land | Improvement |
|---|---|---|---|---|
| 2025 | $8,020 | $533,828 | $162,248 | $378,580 |
| 2024 | $8,020 | $523,226 | $159,068 | $371,158 |
| 2023 | $7,735 | $519,831 | $155,949 | $363,882 |
| 2022 | $7,613 | $502,640 | $152,892 | $356,748 |
| 2021 | $7,415 | $492,648 | $149,894 | $349,754 |
| 2020 | $7,393 | $494,525 | $148,357 | $346,168 |
| 2019 | $7,344 | $484,831 | $145,449 | $339,382 |
| 2018 | $7,166 | $475,327 | $142,598 | $332,729 |
| 2017 | $7,013 | $466,008 | $139,802 | $326,206 |
| 2016 | $6,852 | $456,872 | $137,061 | $319,811 |
| 2015 | $6,765 | $450,010 | $135,003 | $315,007 |
| 2014 | $6,484 | $441,195 | $132,358 | $308,837 |
Source: Public Records
Map
Nearby Homes
- 33064 Compton Ct
- 33018 Soquel St
- 32945 Regents Blvd
- 4852 Nadine Ct
- 34102 Zaner Way
- 4611 Carmen Way
- 34192 Firenze Terrace
- 4639 Michelle Ct
- 5621 Via Lugano
- 34198 Tony Terrace
- 5301 Shamrock Common
- 4532 Delores Dr
- 6004 Pisa Terrace Unit 119
- 32409 Elizabeth Way
- 6003 Milano Terrace Unit 14
- 4272 Warbler Loop
- 32451 Regents Blvd
- 4231 Hanford St
- 32606 Singh Cir
- 4141 Deep Creek Rd Unit 137
- 33148 Mckeown Ct
- 33140 Mckeown Ct
- 33056 Mckeown St
- 33051 Corning Ct
- 4910 Lowry Rd Unit 4910 Lowry Road
- 4910 Lowry Rd Unit 96
- 4911 Bridgepointe Place Unit 106
- 4900 Lowry Rd Unit 97
- 4901 Bridgepointe Place Unit 105
- 33132 Mckeown Ct
- 4912 Lowry Rd Unit 1095
- 4913 Bridgepointe Place
- 33048 Mckeown St
- 4902 Lowry Rd Unit 98
- 33065 Mckeown St
- 4903 Bridgepointe Place
- 33043 Corning Ct
- 4914 Lowry Rd
- 4915 Bridgepointe Place Unit 11108
- 4905 Bridgepointe Place Unit 103