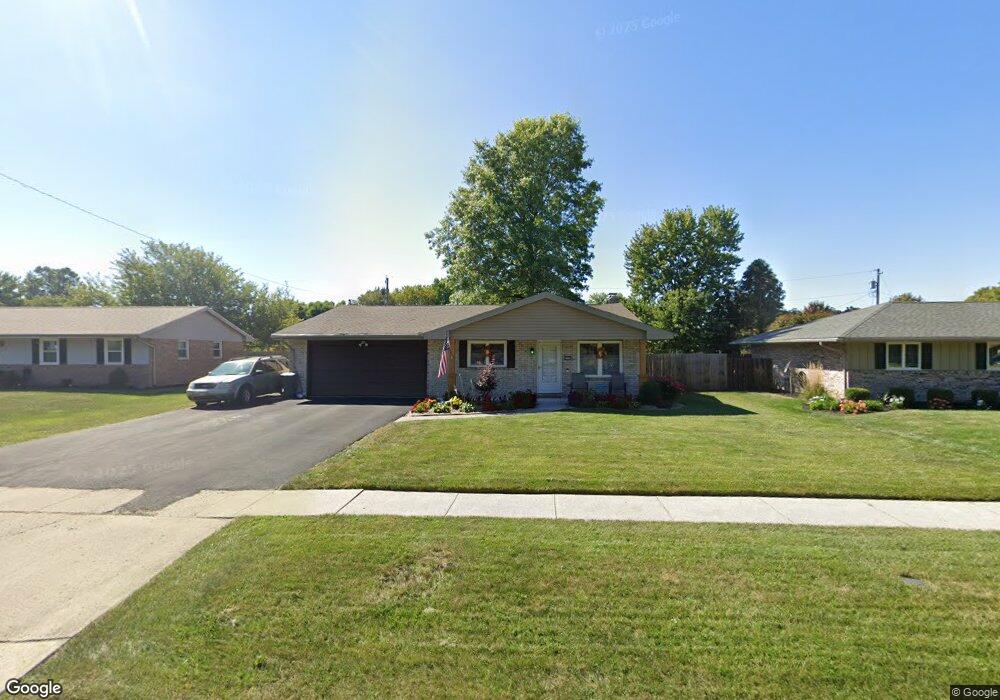
3316 Edgemont Dr Findlay, OH 45840
Estimated Value: $236,000 - $253,000
3
Beds
2
Baths
1,447
Sq Ft
$169/Sq Ft
Est. Value
About This Home
This home is located at 3316 Edgemont Dr, Findlay, OH 45840 and is currently estimated at $243,974, approximately $168 per square foot. 3316 Edgemont Dr is a home located in Hancock County with nearby schools including Bigelow Hill Elementary School, Northview Elementary School, and Glenwood Middle School.
Ownership History
Date
Name
Owned For
Owner Type
Purchase Details
Closed on
Jul 29, 2015
Bought by
Toupalik John M and Toupalik Carol P
Current Estimated Value
Home Financials for this Owner
Home Financials are based on the most recent Mortgage that was taken out on this home.
Interest Rate
4.04%
Purchase Details
Closed on
Jul 12, 2007
Sold by
Williams Paul D and Williams Katherine M
Bought by
Williams Paul D and Williams Katherine M
Purchase Details
Closed on
Apr 14, 1998
Sold by
Oliver Willie
Bought by
Williams Paul and Williams Katherine
Purchase Details
Closed on
Dec 30, 1996
Sold by
May Daniel
Bought by
Olliver Willie
Home Financials for this Owner
Home Financials are based on the most recent Mortgage that was taken out on this home.
Original Mortgage
$99,500
Interest Rate
7.64%
Mortgage Type
VA
Purchase Details
Closed on
Jun 28, 1991
Bought by
May Daniel J
Purchase Details
Closed on
Apr 25, 1986
Bought by
Snare Jeffrey A and Snare Marsha K
Create a Home Valuation Report for This Property
The Home Valuation Report is an in-depth analysis detailing your home's value as well as a comparison with similar homes in the area
Home Values in the Area
Average Home Value in this Area
Purchase History
| Date | Buyer | Sale Price | Title Company |
|---|---|---|---|
| Toupalik John M | $120,000 | -- | |
| Williams Paul D | -- | None Available | |
| Williams Paul | $107,500 | -- | |
| Olliver Willie | $101,500 | -- | |
| May Daniel J | $87,500 | -- | |
| Snare Jeffrey A | $72,500 | -- |
Source: Public Records
Mortgage History
| Date | Status | Borrower | Loan Amount |
|---|---|---|---|
| Closed | Toupalik John M | -- | |
| Previous Owner | Olliver Willie | $99,500 |
Source: Public Records
Tax History Compared to Growth
Tax History
| Year | Tax Paid | Tax Assessment Tax Assessment Total Assessment is a certain percentage of the fair market value that is determined by local assessors to be the total taxable value of land and additions on the property. | Land | Improvement |
|---|---|---|---|---|
| 2024 | $2,231 | $62,740 | $9,770 | $52,970 |
| 2023 | $2,234 | $62,740 | $9,770 | $52,970 |
| 2022 | $2,226 | $62,740 | $9,770 | $52,970 |
| 2021 | $2,090 | $51,300 | $9,790 | $41,510 |
| 2020 | $2,089 | $51,300 | $9,790 | $41,510 |
| 2019 | $1,987 | $49,840 | $9,790 | $40,050 |
| 2018 | $1,778 | $40,910 | $7,530 | $33,380 |
| 2017 | $1,779 | $40,910 | $7,530 | $33,380 |
| 2016 | $1,757 | $40,910 | $7,530 | $33,380 |
| 2015 | $1,786 | $40,840 | $7,530 | $33,310 |
| 2014 | $1,837 | $40,840 | $7,530 | $33,310 |
| 2012 | $1,850 | $40,840 | $7,530 | $33,310 |
Source: Public Records
Map
Nearby Homes
- 3300 Crosshill Dr
- 615 Hillcrest Ave
- 506 Hillcrest Ave
- 126 Hillcrest Ave
- 3239 N Main St
- 1310 Muirfield Dr
- 0 Township Highway 99
- 12325 Township Highway 99
- 3315 Terrace Ln
- 128 Harrington Ave
- 933 Laurel Ln
- 3018 Gleneagle Dr
- 0 County Road 220 Unit 6111396
- 0 County Road 220 Unit 6111394
- 0 County Road 220 Unit 6111400
- 0 Allen Township 142
- 3106 Saddlebrook
- 231 Tioga Ave
- 1405 Cypress Lake
- 643 Edith Ave
- 3320 Edgemont Dr
- 3312 Edgemont Dr
- 3309 Crosshill Dr
- 3324 Edgemont Dr
- 3315 Crosshill Dr
- 3305 Crosshill Dr
- 3308 Edgemont Dr
- 3321 Crosshill Dr
- 3301 Crosshill Dr
- 3319 Edgemont Dr
- 3309 Edgemont Dr
- 3325 Edgemont Dr
- 3304 Edgemont Dr
- 3227 Crosshill Dr
- 3300 Ridgeview Dr
- 3407 Norcrest St
- 3306 Ridgeview Dr
- 3320 Norcrest St
- 3401 Norcrest St
- 3308 Crosshill Dr