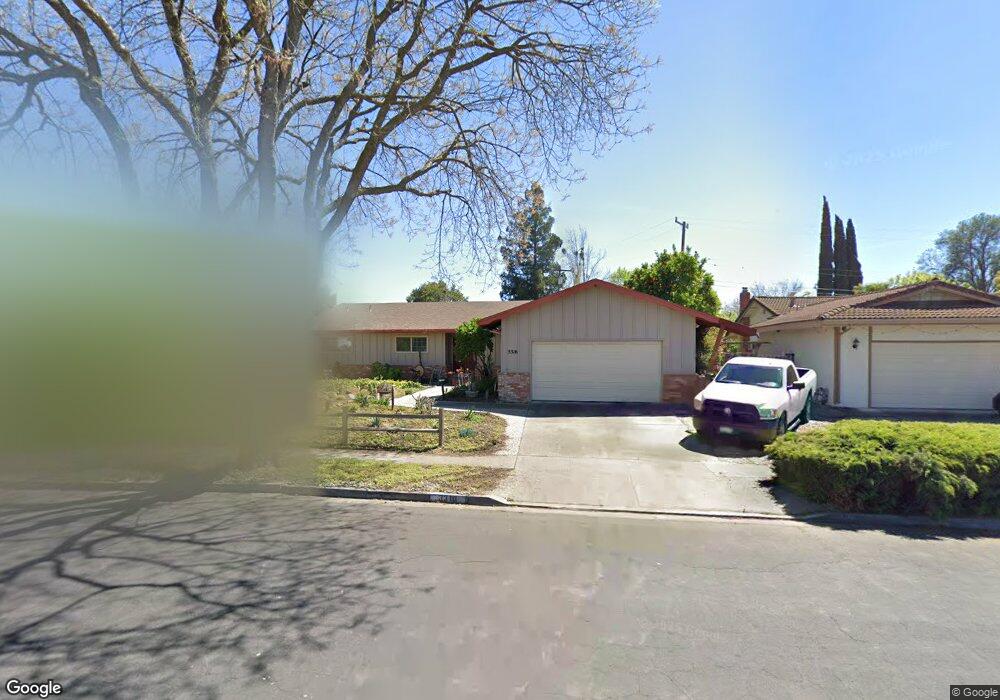
3316 Mckean Dr Concord, CA 94518
Shadelands NeighborhoodEstimated Value: $1,045,349 - $1,085,000
3
Beds
2
Baths
1,818
Sq Ft
$584/Sq Ft
Est. Value
About This Home
This home is located at 3316 Mckean Dr, Concord, CA 94518 and is currently estimated at $1,061,337, approximately $583 per square foot. 3316 Mckean Dr is a home located in Contra Costa County with nearby schools including Woodside Elementary School, Oak Grove Middle School, and Ygnacio Valley High School.
Ownership History
Date
Name
Owned For
Owner Type
Purchase Details
Closed on
Aug 26, 2021
Sold by
Havens Roger M
Bought by
Havens Roger M
Current Estimated Value
Home Financials for this Owner
Home Financials are based on the most recent Mortgage that was taken out on this home.
Original Mortgage
$218,000
Outstanding Balance
$198,068
Interest Rate
2.7%
Mortgage Type
New Conventional
Estimated Equity
$863,269
Purchase Details
Closed on
Jun 23, 2021
Sold by
Ballew Carol M Dodson
Bought by
Heavens Roger M
Purchase Details
Closed on
Apr 16, 2015
Sold by
Havens Harry L
Bought by
Havens Roger M and Dodson Ballew Carol M
Home Financials for this Owner
Home Financials are based on the most recent Mortgage that was taken out on this home.
Original Mortgage
$200,000
Interest Rate
3.8%
Mortgage Type
New Conventional
Purchase Details
Closed on
Sep 24, 2010
Sold by
Havens Harry L
Bought by
Havens Harry L
Purchase Details
Closed on
Dec 1, 1994
Sold by
Havens Harry L and Havens Claire I
Bought by
Havens Harry L and Havens Claire I
Create a Home Valuation Report for This Property
The Home Valuation Report is an in-depth analysis detailing your home's value as well as a comparison with similar homes in the area
Home Values in the Area
Average Home Value in this Area
Purchase History
| Date | Buyer | Sale Price | Title Company |
|---|---|---|---|
| Havens Roger M | -- | Chicago Title Company | |
| Heavens Roger M | -- | None Available | |
| Havens Roger M | $556,500 | North American Title | |
| Havens Harry L | -- | None Available | |
| Havens Harry L | -- | -- |
Source: Public Records
Mortgage History
| Date | Status | Borrower | Loan Amount |
|---|---|---|---|
| Open | Havens Roger M | $218,000 | |
| Previous Owner | Havens Roger M | $200,000 |
Source: Public Records
Tax History Compared to Growth
Tax History
| Year | Tax Paid | Tax Assessment Tax Assessment Total Assessment is a certain percentage of the fair market value that is determined by local assessors to be the total taxable value of land and additions on the property. | Land | Improvement |
|---|---|---|---|---|
| 2025 | $4,169 | $303,217 | $148,755 | $154,462 |
| 2024 | $4,075 | $297,273 | $145,839 | $151,434 |
| 2023 | $4,075 | $291,445 | $142,980 | $148,465 |
| 2022 | $4,004 | $285,731 | $140,177 | $145,554 |
| 2021 | $3,814 | $280,129 | $137,429 | $142,700 |
| 2019 | $3,728 | $271,821 | $133,353 | $138,468 |
| 2018 | $3,575 | $266,492 | $130,739 | $135,753 |
| 2017 | $3,442 | $261,268 | $128,176 | $133,092 |
| 2016 | $3,393 | $256,146 | $125,663 | $130,483 |
| 2015 | $3,343 | $252,300 | $123,776 | $128,524 |
| 2014 | $3,266 | $247,359 | $121,352 | $126,007 |
Source: Public Records
Map
Nearby Homes
- 2765 Ryan Rd
- 721 Santa Ana Ln
- 3055 Treat Blvd Unit 25
- 3050 Barrymore Dr
- 632 Wintergreen Ln
- 738 Mandarin Ln
- 681 Rock Oak Rd
- 3051 Treat Blvd Unit 63
- 3051 Treat Blvd Unit 129
- 2605 Ryan Rd
- 2730 Calpine Place
- 810 Oak Grove Rd Unit 83
- 810 Oak Grove Rd Unit 106
- 889 Madigan Ave
- 2745 Minert Rd
- 825 Oak Grove Rd Unit 35
- 825 Oak Grove Rd Unit 46
- 825 Oak Grove Rd Unit 62
- 886 San Miguel Rd
- 517 Heather Grove Ct
- 3324 Mckean Dr
- 3308 Mckean Dr
- 760 San Simeon Dr
- 3325 Lancashire Place
- 3315 Lancashire Place
- 3332 Mckean Dr
- 3335 Lancashire Place
- 758 San Simeon Dr
- 766 San Simeon Dr
- 3329 Mckean Dr
- 3260 Mckean Dr
- 3345 Lancashire Place
- 756 San Simeon Dr
- 768 San Simeon Dr
- 3340 Mckean Dr
- 3335 Mckean Dr
- 767 San Simeon Dr
- 3330 Lancashire Place
- 3250 Mckean Dr
- 3320 Lancashire Place