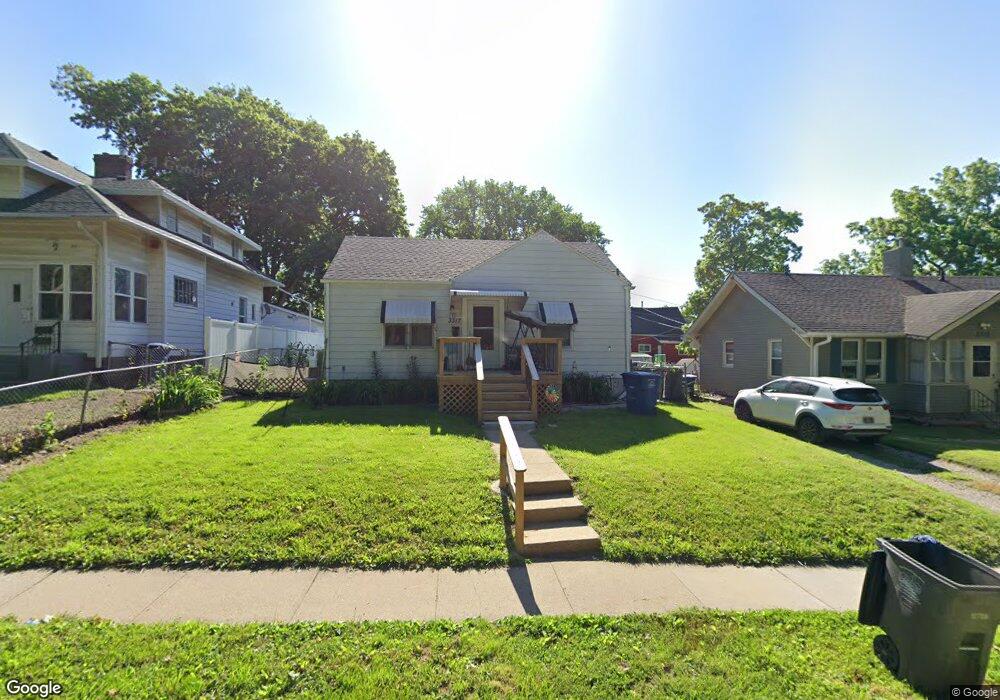
3317 3rd St Des Moines, IA 50313
Highland Park NeighborhoodEstimated Value: $129,000 - $145,000
2
Beds
1
Bath
720
Sq Ft
$189/Sq Ft
Est. Value
About This Home
This home is located at 3317 3rd St, Des Moines, IA 50313 and is currently estimated at $136,202, approximately $189 per square foot. 3317 3rd St is a home located in Polk County with nearby schools including Oak Park Elementary School, Harding Middle School, and North High School.
Ownership History
Date
Name
Owned For
Owner Type
Purchase Details
Closed on
Apr 11, 2019
Sold by
Huffey Ernest and Huffey Victoria
Bought by
Pope Russell Joseph
Current Estimated Value
Home Financials for this Owner
Home Financials are based on the most recent Mortgage that was taken out on this home.
Original Mortgage
$63,000
Outstanding Balance
$55,388
Interest Rate
4.4%
Mortgage Type
New Conventional
Estimated Equity
$80,814
Purchase Details
Closed on
May 13, 2017
Sold by
Huffey Ernest and Huffey Victoria
Bought by
Pope Russell Joseph
Purchase Details
Closed on
Feb 12, 2015
Sold by
Murray Martin I and Lubbert Arthur C
Bought by
Huffey Ernest and Huffey Victoria
Purchase Details
Closed on
Dec 4, 2009
Sold by
Murray Martin and Lubbert Arthur
Bought by
Murray Martin
Purchase Details
Closed on
Mar 21, 2007
Sold by
Lubbert Arthur C
Bought by
Lubbert Arthur C and Murray Martin I
Create a Home Valuation Report for This Property
The Home Valuation Report is an in-depth analysis detailing your home's value as well as a comparison with similar homes in the area
Home Values in the Area
Average Home Value in this Area
Purchase History
| Date | Buyer | Sale Price | Title Company |
|---|---|---|---|
| Pope Russell Joseph | $85,000 | None Available | |
| Pope Russell Joseph | $85,000 | None Available | |
| Huffey Ernest | $27,500 | None Available | |
| Murray Martin | -- | None Available | |
| Lubbert Arthur C | -- | None Available |
Source: Public Records
Mortgage History
| Date | Status | Borrower | Loan Amount |
|---|---|---|---|
| Open | Pope Russell Joseph | $63,000 |
Source: Public Records
Tax History
| Year | Tax Paid | Tax Assessment Tax Assessment Total Assessment is a certain percentage of the fair market value that is determined by local assessors to be the total taxable value of land and additions on the property. | Land | Improvement |
|---|---|---|---|---|
| 2025 | $1,782 | $115,400 | $29,100 | $86,300 |
| 2024 | $1,782 | $101,000 | $25,200 | $75,800 |
| 2023 | $1,780 | $101,000 | $25,200 | $75,800 |
| 2022 | $1,764 | $84,400 | $21,300 | $63,100 |
| 2021 | $1,682 | $84,400 | $21,300 | $63,100 |
| 2020 | $1,742 | $76,000 | $19,100 | $56,900 |
| 2019 | $1,674 | $76,000 | $19,100 | $56,900 |
| 2018 | $1,652 | $70,800 | $17,400 | $53,400 |
| 2017 | $1,740 | $70,800 | $17,400 | $53,400 |
| 2016 | $1,694 | $64,300 | $15,600 | $48,700 |
| 2015 | $1,694 | $64,300 | $15,600 | $48,700 |
| 2014 | $1,932 | $60,800 | $14,500 | $46,300 |
Source: Public Records
Map
Nearby Homes
Your Personal Tour Guide
Ask me questions while you tour the home.