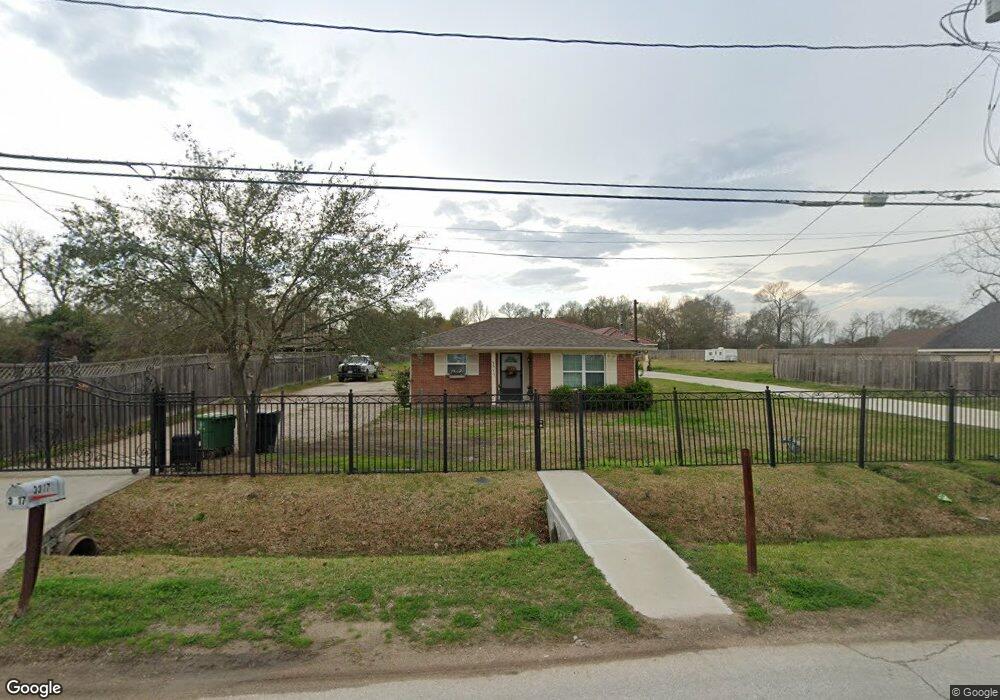
3317 De Soto St Houston, TX 77091
Acres Homes NeighborhoodEstimated Value: $262,000 - $824,022
3
Beds
2
Baths
1,180
Sq Ft
$520/Sq Ft
Est. Value
About This Home
This home is located at 3317 De Soto St, Houston, TX 77091 and is currently estimated at $613,256, approximately $519 per square foot. 3317 De Soto St is a home located in Harris County with nearby schools including Edward a Vines EC/Pre-K/K School, Harris Elementary School, and Hoffman Middle School.
Ownership History
Date
Name
Owned For
Owner Type
Purchase Details
Closed on
Jul 27, 2017
Sold by
Valdez Prokopiou Pilita and Valdez Prokopiou Pilita
Bought by
Marcia Lucy and Marcia Jesus
Current Estimated Value
Home Financials for this Owner
Home Financials are based on the most recent Mortgage that was taken out on this home.
Original Mortgage
$184,103
Outstanding Balance
$153,245
Interest Rate
3.87%
Mortgage Type
FHA
Estimated Equity
$460,011
Purchase Details
Closed on
Jul 20, 2017
Sold by
Prokopiou Marios Ktriacos and Prokopiou Marios
Bought by
Prokopiou Pilita Valdez
Home Financials for this Owner
Home Financials are based on the most recent Mortgage that was taken out on this home.
Original Mortgage
$184,103
Outstanding Balance
$153,245
Interest Rate
3.87%
Mortgage Type
FHA
Estimated Equity
$460,011
Purchase Details
Closed on
Feb 25, 2016
Sold by
Prokopiou Stefanie
Bought by
Prokopiou Pilita and Prokopiou Marios
Purchase Details
Closed on
Mar 19, 2012
Sold by
Williams Sylvia Ann and Williams Nathaniel
Bought by
Prokopiou Stefanie
Create a Home Valuation Report for This Property
The Home Valuation Report is an in-depth analysis detailing your home's value as well as a comparison with similar homes in the area
Home Values in the Area
Average Home Value in this Area
Purchase History
| Date | Buyer | Sale Price | Title Company |
|---|---|---|---|
| Marcia Lucy | -- | Chicago Title | |
| Prokopiou Pilita Valdez | -- | Chicago Title | |
| Prokopiou Pilita | -- | None Available | |
| Prokopiou Stefanie | -- | None Available |
Source: Public Records
Mortgage History
| Date | Status | Borrower | Loan Amount |
|---|---|---|---|
| Open | Marcia Lucy | $184,103 |
Source: Public Records
Tax History Compared to Growth
Tax History
| Year | Tax Paid | Tax Assessment Tax Assessment Total Assessment is a certain percentage of the fair market value that is determined by local assessors to be the total taxable value of land and additions on the property. | Land | Improvement |
|---|---|---|---|---|
| 2025 | $12,459 | $945,000 | $605,010 | $339,990 |
| 2024 | $12,459 | $948,874 | $605,010 | $343,864 |
| 2023 | $12,459 | $842,000 | $526,096 | $315,904 |
| 2022 | $13,142 | $700,000 | $328,810 | $371,190 |
| 2021 | $11,152 | $491,000 | $263,048 | $227,952 |
| 2020 | $5,381 | $244,058 | $164,405 | $79,653 |
| 2019 | $5,128 | $223,336 | $164,405 | $58,931 |
| 2018 | $2,060 | $168,472 | $111,795 | $56,677 |
| 2017 | $4,469 | $168,472 | $111,795 | $56,677 |
| 2016 | $3,932 | $148,217 | $98,643 | $49,574 |
| 2015 | $3,309 | $148,217 | $98,643 | $49,574 |
| 2014 | $3,309 | $124,360 | $62,474 | $61,886 |
Source: Public Records
Map
Nearby Homes
- 6024 T C Jester Blvd
- 3211 De Soto St
- 0000 T C Jester Blvd
- 3414 Mansfield St
- 3406 Mansfield St
- 5917 Manning Oaks St
- 5916 Manning Oaks St
- 5913 Manning Oaks St
- 5914 Manning Oaks St
- 3422 Mansfield St
- 6413 T C Jester Blvd
- 00 T C Jester
- 5505 T C Jester Blvd
- Honeysuckle Plan at Mansfield Estates
- Daisy Plan at Mansfield Estates
- 5929 Manning Oaks St
- 3216 Mansfield St Unit 5903
- 3216 Mansfield St Unit 5904
- 6004 Balbo St
- 3110 Druid St
- 3327 De Soto St
- 3301 De Soto St
- 3301 De Soto St
- 3313 De Soto St
- 3401 De Soto St
- 3229 De Soto St
- 3225 De Soto St
- 3406 De Soto St
- 3221 De Soto St
- 3414 De Soto St
- 3410 De Soto St
- 6135 Balbo St
- 6022 T C Jester Blvd
- 3202 De Soto St
- 6132 de Campo St
- 6132 de Campo St Unit A
- 3429 De Soto St
- 3518 De Soto St
- 3322 Mansfield St
- 6017 Balbo St