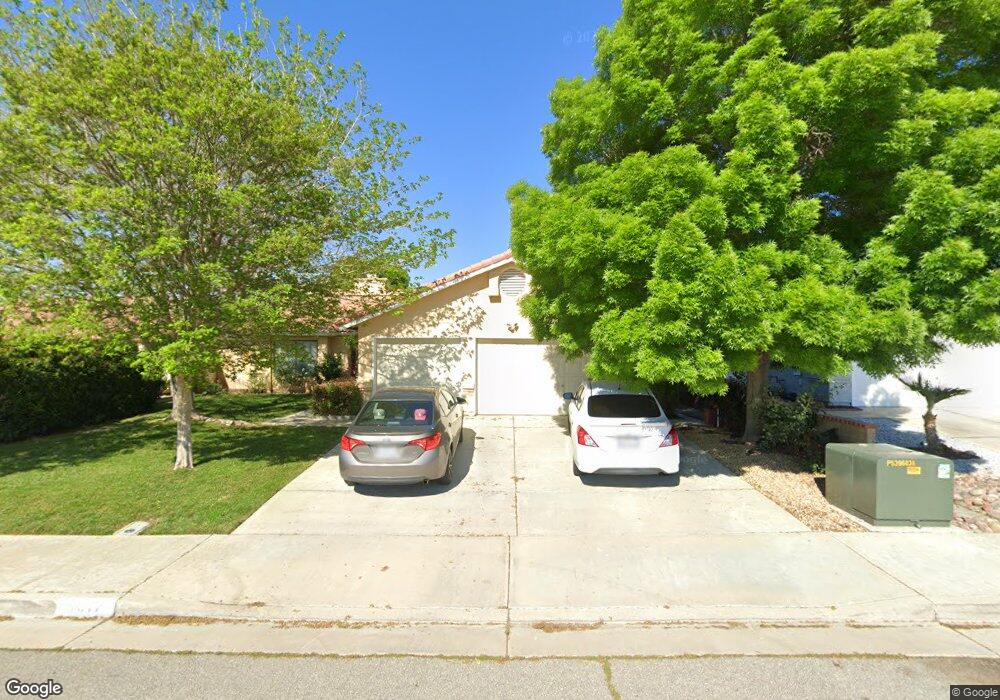
3317 Discovery Way Rosamond, CA 93560
Estimated Value: $383,614 - $421,000
3
Beds
2
Baths
1,473
Sq Ft
$271/Sq Ft
Est. Value
About This Home
This home is located at 3317 Discovery Way, Rosamond, CA 93560 and is currently estimated at $398,654, approximately $270 per square foot. 3317 Discovery Way is a home located in Kern County.
Ownership History
Date
Name
Owned For
Owner Type
Purchase Details
Closed on
Jun 18, 2004
Sold by
Henriquez Rafael
Bought by
Henriquez Rafael and Henriquez Aurea
Current Estimated Value
Purchase Details
Closed on
Jan 7, 1999
Sold by
Hud
Bought by
Henriquez Rafael
Home Financials for this Owner
Home Financials are based on the most recent Mortgage that was taken out on this home.
Original Mortgage
$67,500
Outstanding Balance
$15,481
Interest Rate
6.63%
Estimated Equity
$383,173
Purchase Details
Closed on
Jan 5, 1999
Sold by
Henriquez Aurea
Bought by
Henriquez Rafael
Home Financials for this Owner
Home Financials are based on the most recent Mortgage that was taken out on this home.
Original Mortgage
$67,500
Outstanding Balance
$15,481
Interest Rate
6.63%
Estimated Equity
$383,173
Purchase Details
Closed on
Jun 25, 1998
Sold by
Greystone
Bought by
Va
Purchase Details
Closed on
Sep 30, 1997
Sold by
Valdez Frank Rey and Valdez Rosemary
Bought by
Greystone
Create a Home Valuation Report for This Property
The Home Valuation Report is an in-depth analysis detailing your home's value as well as a comparison with similar homes in the area
Home Values in the Area
Average Home Value in this Area
Purchase History
| Date | Buyer | Sale Price | Title Company |
|---|---|---|---|
| Henriquez Rafael | -- | -- | |
| Henriquez Rafael | $75,000 | American Title Co | |
| Henriquez Rafael | -- | American Title Co | |
| Va | -- | Fidelity National Title Ins | |
| Greystone | $128,110 | Fidelity National Title Ins |
Source: Public Records
Mortgage History
| Date | Status | Borrower | Loan Amount |
|---|---|---|---|
| Open | Henriquez Rafael | $67,500 |
Source: Public Records
Tax History Compared to Growth
Tax History
| Year | Tax Paid | Tax Assessment Tax Assessment Total Assessment is a certain percentage of the fair market value that is determined by local assessors to be the total taxable value of land and additions on the property. | Land | Improvement |
|---|---|---|---|---|
| 2025 | $2,840 | $117,547 | $28,205 | $89,342 |
| 2024 | $2,718 | $115,243 | $27,652 | $87,591 |
| 2023 | $2,718 | $112,984 | $27,110 | $85,874 |
| 2022 | $2,587 | $110,770 | $26,579 | $84,191 |
| 2021 | $2,433 | $108,599 | $26,058 | $82,541 |
| 2020 | $2,385 | $107,486 | $25,791 | $81,695 |
| 2019 | $1,491 | $107,486 | $25,791 | $81,695 |
| 2018 | $1,451 | $103,315 | $24,791 | $78,524 |
| 2017 | $1,429 | $101,290 | $24,305 | $76,985 |
| 2016 | $1,368 | $99,305 | $23,829 | $75,476 |
| 2015 | $1,371 | $97,815 | $23,472 | $74,343 |
| 2014 | $1,744 | $95,900 | $23,013 | $72,887 |
Source: Public Records
Map
Nearby Homes
- 3432 Starjet St
- 3332 Clark St
- 2300 E Valley Vista
- 0 California 14
- 3236 Shelley St
- 3172 Shelley St
- 3223 Glendower St
- 0 Rosewood Ave Unit 25007619
- 0 Rosewood Ave Unit SR25227946
- 0 Rosamond Blvd Unit SR25215952
- 0 Rosamond Blvd Unit 24001287
- 0 Rosamond Blvd Unit 25001455
- 0 Rosamond Blvd Unit SR24035699
- 0 Rosamond Blvd Unit 9989929
- 0 Rosamond Blvd Unit TR25223064
- 0 Rosamond Blvd Unit 25007759
- 0 Rosamond Blvd Unit 25008396
- 0 Rosamond Blvd Unit 202405880
- 0 Rosamond Blvd Unit IG25233654
- 3600 Gold Stone Ln
- 3325 Discovery Way
- 3309 Discovery Way
- 3316 Voyager St
- 3324 Voyager St
- 3308 Voyager St
- 3333 Discovery Way
- 3301 Discovery Way
- 3332 Voyager St
- 3300 Voyager St
- 3316 Discovery Way
- 3308 Discovery Way
- 3341 Discovery Way
- 3293 Discovery Way
- 3300 Discovery Way
- 3340 Voyager St
- 3292 Voyager St
- 3332 Discovery Way
- 3292 Discovery Way
- 3285 Discovery Way
- 3349 Discovery Way