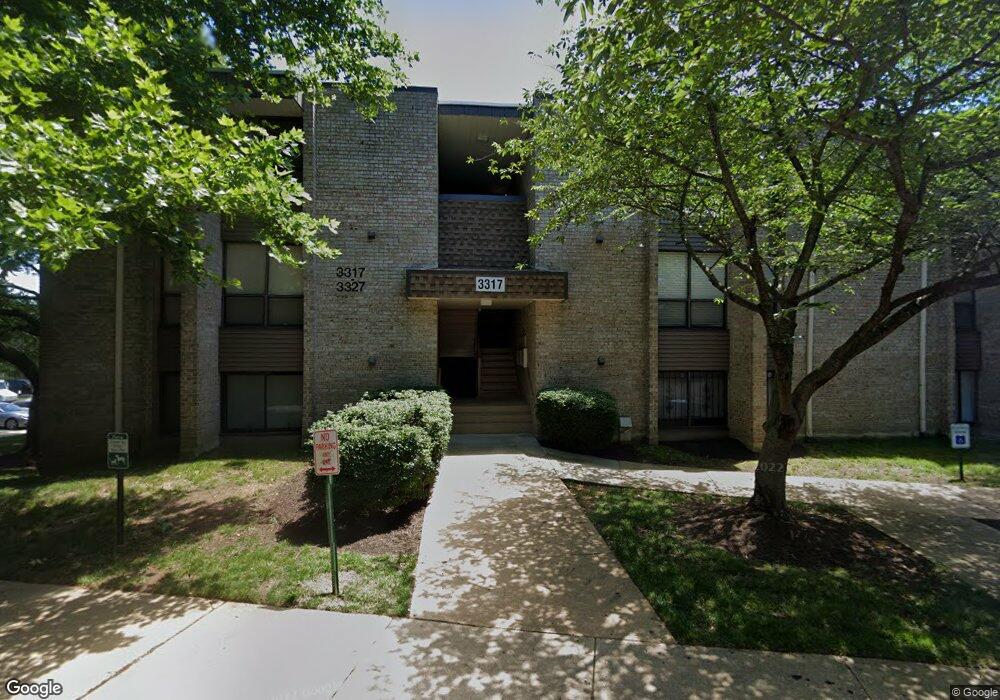
3317 Huntley Square Dr Unit C2 Temple Hills, MD 20748
Estimated Value: $147,714 - $223,000
--
Bed
--
Bath
1,031
Sq Ft
$162/Sq Ft
Est. Value
About This Home
This home is located at 3317 Huntley Square Dr Unit C2, Temple Hills, MD 20748 and is currently estimated at $167,429, approximately $162 per square foot. 3317 Huntley Square Dr Unit C2 is a home located in Prince George's County with nearby schools including J. Frank Dent Elementary School, Thurgood Marshall Middle School, and Crossland High School.
Ownership History
Date
Name
Owned For
Owner Type
Purchase Details
Closed on
Apr 15, 2019
Sold by
Brice Natosha
Bought by
Gans Joseph and Gans Mary L
Current Estimated Value
Home Financials for this Owner
Home Financials are based on the most recent Mortgage that was taken out on this home.
Original Mortgage
$118,000
Outstanding Balance
$103,103
Interest Rate
4%
Mortgage Type
VA
Estimated Equity
$64,326
Purchase Details
Closed on
Aug 12, 2015
Sold by
Navy Federal Credit Union
Bought by
Brice Natosha
Purchase Details
Closed on
Jul 27, 2015
Sold by
Maxwell Quanteia F
Bought by
Navy Federal Credit Union
Purchase Details
Closed on
Jul 9, 2004
Sold by
Collins Paul T and Collins Eloise T
Bought by
Ferguson Quanteia and Unit C2
Purchase Details
Closed on
Dec 20, 1996
Sold by
Collins Paul T and Collins Eloise T
Bought by
Penn Jonathan
Create a Home Valuation Report for This Property
The Home Valuation Report is an in-depth analysis detailing your home's value as well as a comparison with similar homes in the area
Home Values in the Area
Average Home Value in this Area
Purchase History
| Date | Buyer | Sale Price | Title Company |
|---|---|---|---|
| Gans Joseph | $118,000 | Home First Title Group Llc | |
| Brice Natosha | $37,000 | Michaels Title & Escrow Llc | |
| Navy Federal Credit Union | $31,930 | Legends Title Group Llc | |
| Ferguson Quanteia | $96,000 | -- | |
| Penn Jonathan | $73,000 | -- |
Source: Public Records
Mortgage History
| Date | Status | Borrower | Loan Amount |
|---|---|---|---|
| Open | Gans Joseph | $118,000 |
Source: Public Records
Tax History Compared to Growth
Tax History
| Year | Tax Paid | Tax Assessment Tax Assessment Total Assessment is a certain percentage of the fair market value that is determined by local assessors to be the total taxable value of land and additions on the property. | Land | Improvement |
|---|---|---|---|---|
| 2024 | $1,585 | $100,000 | $30,000 | $70,000 |
| 2023 | $1,544 | $97,333 | $0 | $0 |
| 2022 | $1,504 | $94,667 | $0 | $0 |
| 2021 | $1,465 | $92,000 | $27,600 | $64,400 |
| 2020 | $2,464 | $76,333 | $0 | $0 |
| 2019 | $869 | $60,667 | $0 | $0 |
| 2018 | $766 | $45,000 | $10,000 | $35,000 |
| 2017 | $667 | $41,667 | $0 | $0 |
| 2016 | -- | $38,333 | $0 | $0 |
| 2015 | $1,925 | $35,000 | $0 | $0 |
| 2014 | $1,925 | $35,000 | $0 | $0 |
Source: Public Records
Map
Nearby Homes
- 3331 Huntley Square Dr Unit C
- 3344 Huntley Square Dr Unit B
- 3330 Huntley Square Dr Unit A2
- 3310 Huntley Square Dr Unit A2
- 3142 Brinkley Rd Unit 304
- 6204 Joe Klutsch Dr
- 3140 Brinkley Rd Unit 302
- 3138 Brinkley Rd Unit 8303
- 3138 Brinkley Rd Unit 202
- 3208 Mulberry Ln
- 3413 Cpt Wendell Pruitt Way
- 3002 Brinkley Station Dr
- 3700 Copperville Way
- 3110 Gallop Way
- 5704 Joan Ln
- 6015 Glen Rock Ave
- 5629 Fisher Rd
- 7013 Noah Dr
- 2816 Lindesfarn Terrace
- 3733 Portal Ave
- 3317 Huntley Square Dr
- 3317 Huntley Square Dr
- 3317 Huntley Square Dr
- 3317 Huntley Square Dr
- 3317 Huntley Square Dr Unit C1
- 3317 Huntley Square Dr
- 3317 Huntley Square Dr
- 3317 Huntley Square Dr Unit B-2
- 3317 Huntley Square Dr Unit B2
- 3317 Huntley Square Dr Unit A1
- 3317 Huntley Square Dr Unit A2
- 3317 Huntley Square Dr Unit T2
- 3317 Huntley Square Dr Unit A
- 3317 Huntley Square Dr Unit C
- 3317 Huntley Square Dr Unit T
- 3319 Huntley Square Dr Unit T1
- 3319 Huntley Square Dr
- 3319 Huntley Square Dr Unit T2
- 3319 Huntley Square Dr
- 3319 Huntley Square Dr Unit A1