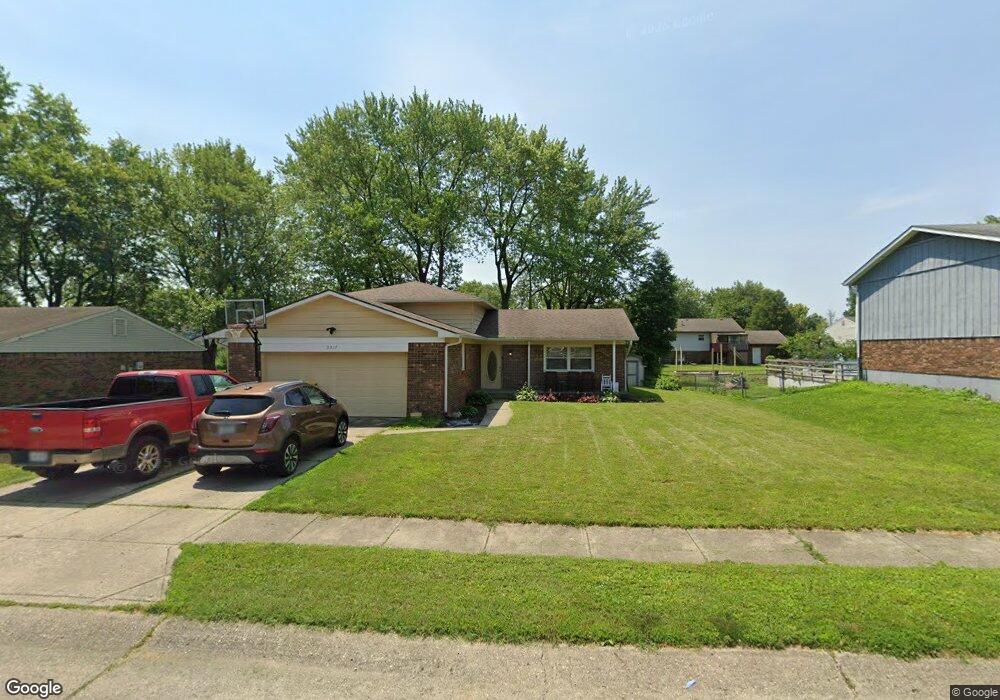
3317 Lacy Ct Indianapolis, IN 46227
South Perry NeighborhoodEstimated Value: $262,000 - $296,000
4
Beds
3
Baths
1,920
Sq Ft
$145/Sq Ft
Est. Value
About This Home
This home is located at 3317 Lacy Ct, Indianapolis, IN 46227 and is currently estimated at $278,298, approximately $144 per square foot. 3317 Lacy Ct is a home located in Marion County with nearby schools including Southport Elementary School, Southport 6th Grade Academy, and Southport Middle School.
Ownership History
Date
Name
Owned For
Owner Type
Purchase Details
Closed on
May 31, 2018
Sold by
Tracy Donna L
Bought by
Tracy Donna L and Miller Lisa
Current Estimated Value
Purchase Details
Closed on
Oct 16, 2009
Sold by
Diversified Realty Centre Inc
Bought by
Tracy Donna L
Home Financials for this Owner
Home Financials are based on the most recent Mortgage that was taken out on this home.
Original Mortgage
$101,134
Outstanding Balance
$64,754
Interest Rate
5.1%
Mortgage Type
FHA
Estimated Equity
$213,544
Purchase Details
Closed on
Sep 28, 2009
Sold by
Clements Richard J and Clements Donna L
Bought by
Diversified Realty Centre
Home Financials for this Owner
Home Financials are based on the most recent Mortgage that was taken out on this home.
Original Mortgage
$101,134
Outstanding Balance
$64,754
Interest Rate
5.1%
Mortgage Type
FHA
Estimated Equity
$213,544
Create a Home Valuation Report for This Property
The Home Valuation Report is an in-depth analysis detailing your home's value as well as a comparison with similar homes in the area
Home Values in the Area
Average Home Value in this Area
Purchase History
| Date | Buyer | Sale Price | Title Company |
|---|---|---|---|
| Tracy Donna L | -- | None Available | |
| Tracy Donna L | -- | Title One | |
| Diversified Realty Centre | $52,000 | None Available |
Source: Public Records
Mortgage History
| Date | Status | Borrower | Loan Amount |
|---|---|---|---|
| Open | Tracy Donna L | $101,134 |
Source: Public Records
Tax History
| Year | Tax Paid | Tax Assessment Tax Assessment Total Assessment is a certain percentage of the fair market value that is determined by local assessors to be the total taxable value of land and additions on the property. | Land | Improvement |
|---|---|---|---|---|
| 2025 | $3,752 | $300,300 | $26,600 | $273,700 |
| 2024 | $3,639 | $292,000 | $26,600 | $265,400 |
| 2023 | $3,639 | $278,200 | $26,600 | $251,600 |
| 2022 | $3,375 | $253,200 | $26,600 | $226,600 |
| 2021 | $2,818 | $208,300 | $26,600 | $181,700 |
Source: Public Records
Map
Nearby Homes
- 3309 Wedgewood Dr
- 7832 Hearthstone Way
- 3402 Xenia Cir
- 3514 Winchester Dr
- 3516 Winchester Dr
- 3603 Dawnwood Dr
- 7620 Marywood Dr
- 3311 Remington Dr
- 7912 S Sherman Dr
- 3314 Montgomery Dr
- 7620 Snowflake Dr
- 3743 E Stop 11 Rd
- 3737 Lima North Dr
- 7613 Dawnwood Ct
- 2716 Marywood Dr
- 8346 Montgomery Ave
- 7546 Miracle Rd
- 8358 Montgomery Ave
- 3620 Mistletoe Dr
- 3702 Fredricksburg Dr
Your Personal Tour Guide
Ask me questions while you tour the home.