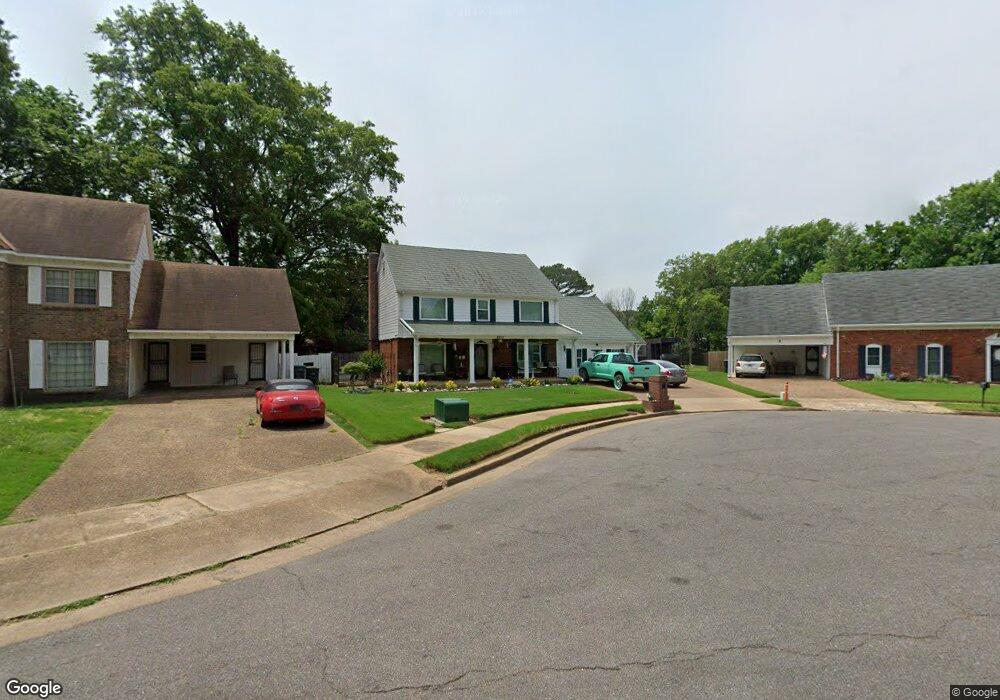
3317 Spencer Dr Memphis, TN 38115
Fox Meadows NeighborhoodEstimated Value: $236,000 - $262,000
4
Beds
3
Baths
2,786
Sq Ft
$89/Sq Ft
Est. Value
About This Home
This home is located at 3317 Spencer Dr, Memphis, TN 38115 and is currently estimated at $247,402, approximately $88 per square foot. 3317 Spencer Dr is a home located in Shelby County with nearby schools including Newberry Elementary School, Wooddale High School, and Compass Community School Hickory Hill Campus.
Ownership History
Date
Name
Owned For
Owner Type
Purchase Details
Closed on
May 23, 2003
Sold by
Citifinancial Mortgage Co Inc
Bought by
Milnor Walker
Current Estimated Value
Home Financials for this Owner
Home Financials are based on the most recent Mortgage that was taken out on this home.
Original Mortgage
$100,800
Interest Rate
5.29%
Mortgage Type
Purchase Money Mortgage
Purchase Details
Closed on
Feb 28, 2003
Sold by
Washington George and Washington Ruth Ann
Bought by
Citifinancial Mortgage Co Inc
Purchase Details
Closed on
Oct 7, 1999
Sold by
Holmon Garland R
Bought by
Washington George and Washington Ruth Ann
Home Financials for this Owner
Home Financials are based on the most recent Mortgage that was taken out on this home.
Original Mortgage
$104,517
Interest Rate
7.76%
Purchase Details
Closed on
Dec 4, 1998
Sold by
Worley Michael L and Worley Lynn C
Bought by
Hud
Purchase Details
Closed on
Oct 4, 1994
Bought by
Worley Michael L and Worley C
Create a Home Valuation Report for This Property
The Home Valuation Report is an in-depth analysis detailing your home's value as well as a comparison with similar homes in the area
Home Values in the Area
Average Home Value in this Area
Purchase History
| Date | Buyer | Sale Price | Title Company |
|---|---|---|---|
| Milnor Walker | $85,000 | Edco Title & Closing Service | |
| Citifinancial Mortgage Co Inc | $100,000 | -- | |
| Washington George | $106,000 | Equity Title & Escrow Co | |
| Hud | $107,108 | -- | |
| Worley Michael L | $97,500 | -- |
Source: Public Records
Mortgage History
| Date | Status | Borrower | Loan Amount |
|---|---|---|---|
| Previous Owner | Milnor Walker | $100,800 | |
| Previous Owner | Washington George | $104,517 |
Source: Public Records
Tax History Compared to Growth
Tax History
| Year | Tax Paid | Tax Assessment Tax Assessment Total Assessment is a certain percentage of the fair market value that is determined by local assessors to be the total taxable value of land and additions on the property. | Land | Improvement |
|---|---|---|---|---|
| 2025 | $1,559 | $64,400 | $5,375 | $59,025 |
| 2024 | $1,559 | $45,975 | $4,800 | $41,175 |
| 2023 | $2,801 | $45,975 | $4,800 | $41,175 |
| 2022 | $2,801 | $45,975 | $4,800 | $41,175 |
| 2021 | $2,833 | $45,975 | $4,800 | $41,175 |
| 2020 | $2,060 | $28,425 | $4,800 | $23,625 |
| 2019 | $1,837 | $25,350 | $4,800 | $20,550 |
| 2018 | $1,837 | $25,350 | $4,800 | $20,550 |
| 2017 | $1,042 | $25,350 | $4,800 | $20,550 |
| 2016 | $993 | $22,725 | $0 | $0 |
| 2014 | $993 | $22,725 | $0 | $0 |
Source: Public Records
Map
Nearby Homes
- 3410 Emerald St
- 5531 Knight Arnold Rd
- 3257 Clarke Rd
- 3229 Thirteen Colony Mall Unit 5B
- 3243 Thirteen Colony Mall Unit 2B
- 3218 Thirteen Colony Mall Unit 1A
- 3218 13 Colony Mall
- 3212 Thirteen Colony Mall Unit 3A
- 5639 Clarke Cove
- 5281 Scottsdale Ave Unit 6
- 5275 Scottsdale Ave Unit 9
- 3397 Adeline St Unit 38
- 3467 Fox Meadows Rd
- 3446 Fox Meadows Rd
- 3068 S Mendenhall Rd
- 3199 Dothan St
- 3016 Egan Dr
- 3340 Foxbriar Dr
- 3693 Hyacinth Dr
- 5134 Scottsdale Ave
- 3315 Spencer Dr
- 3321 Spencer Dr
- 5492 Scottsdale Ave
- 5500 Scottsdale Ave
- 5484 Scottsdale Ave
- 3311 Spencer Dr
- 3325 Spencer Dr
- 5508 Scottsdale Ave
- 3328 Emerald St
- 3318 Emerald St
- 3322 Spencer Dr
- 3338 Emerald St
- 3303 Spencer Dr
- 3308 Emerald St
- 3333 Caribou Dr
- 5518 Scottsdale Ave
- 3298 Spencer Dr
- 5491 Scottsdale Ave
- 3317 Caribou Dr
- 5499 Scottsdale Ave