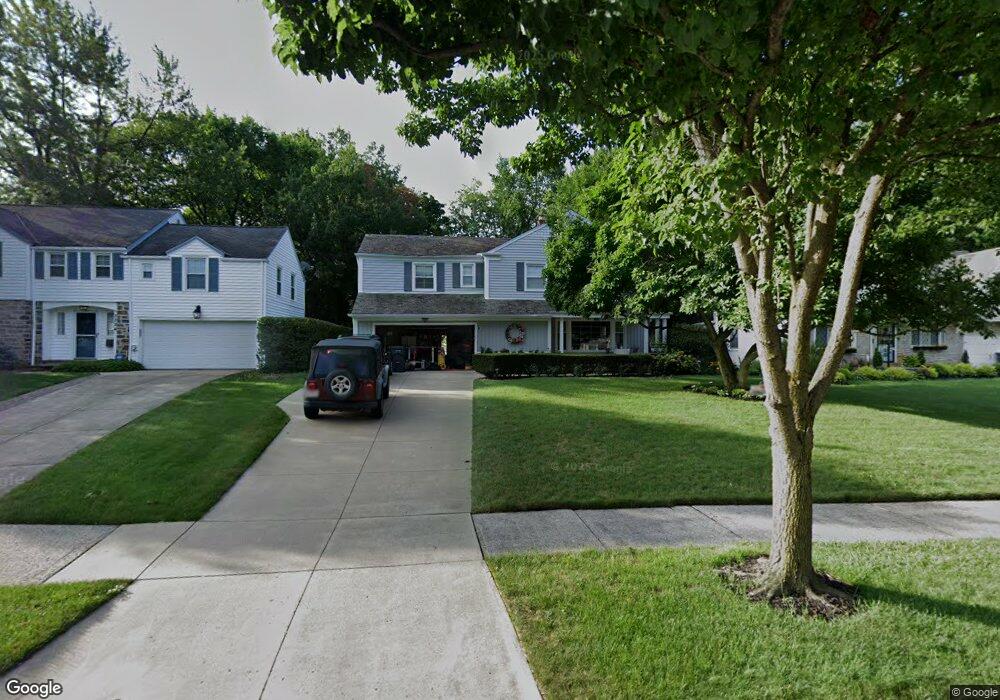
3318 Chelsea Dr Cleveland, OH 44118
Monticello-Noble NeighborhoodEstimated Value: $257,515 - $283,000
4
Beds
2
Baths
2,037
Sq Ft
$133/Sq Ft
Est. Value
About This Home
This home is located at 3318 Chelsea Dr, Cleveland, OH 44118 and is currently estimated at $271,879, approximately $133 per square foot. 3318 Chelsea Dr is a home located in Cuyahoga County with nearby schools including Shaw High School, Yeshiva Derech Hatorah, and Hebrew Academy of Cleveland.
Ownership History
Date
Name
Owned For
Owner Type
Purchase Details
Closed on
Jul 31, 2002
Sold by
Hud
Bought by
Lentz Martin P and Lentz Ellen M
Current Estimated Value
Home Financials for this Owner
Home Financials are based on the most recent Mortgage that was taken out on this home.
Original Mortgage
$66,300
Interest Rate
6.04%
Purchase Details
Closed on
Jan 18, 2002
Sold by
Smith Lezlie R and Stroman Howard
Bought by
Hud
Purchase Details
Closed on
Feb 9, 1996
Sold by
Sheriff Of Cuyahoga Coun
Bought by
Federal National Mortgage Assn
Purchase Details
Closed on
Jul 15, 1993
Sold by
Dureiko Dan R
Bought by
Cox Sharon
Purchase Details
Closed on
Nov 12, 1992
Sold by
Thomas C Douglas
Bought by
Itt Financial Services
Purchase Details
Closed on
Aug 11, 1989
Bought by
Thomas Ella
Purchase Details
Closed on
Oct 3, 1985
Sold by
Thomas Ella M
Bought by
Thorp Discount Inc
Purchase Details
Closed on
Jan 1, 1975
Bought by
Thomas Ella M
Create a Home Valuation Report for This Property
The Home Valuation Report is an in-depth analysis detailing your home's value as well as a comparison with similar homes in the area
Home Values in the Area
Average Home Value in this Area
Purchase History
| Date | Buyer | Sale Price | Title Company |
|---|---|---|---|
| Lentz Martin P | $156,000 | Gateway Title Agency Inc | |
| Hud | $125,000 | -- | |
| Federal National Mortgage Assn | $86,667 | -- | |
| Cox Sharon | $129,900 | -- | |
| Dureiko Dan R | $57,000 | -- | |
| Itt Financial Services | $54,000 | -- | |
| Thomas Ella | -- | -- | |
| Thomas C Douglas | -- | -- | |
| Thorp Discount Inc | -- | -- | |
| Thomas Ella M | -- | -- |
Source: Public Records
Mortgage History
| Date | Status | Borrower | Loan Amount |
|---|---|---|---|
| Closed | Lentz Martin P | $66,300 | |
| Closed | Lentz Martin P | $78,000 |
Source: Public Records
Tax History Compared to Growth
Tax History
| Year | Tax Paid | Tax Assessment Tax Assessment Total Assessment is a certain percentage of the fair market value that is determined by local assessors to be the total taxable value of land and additions on the property. | Land | Improvement |
|---|---|---|---|---|
| 2024 | $5,118 | $81,725 | $12,635 | $69,090 |
| 2023 | $4,261 | $48,900 | $10,080 | $38,820 |
| 2022 | $4,248 | $139,700 | $28,800 | $110,900 |
| 2021 | $4,212 | $48,900 | $10,080 | $38,820 |
| 2020 | $3,950 | $42,140 | $8,680 | $33,460 |
| 2019 | $4,145 | $120,400 | $24,800 | $95,600 |
| 2018 | $3,502 | $42,140 | $8,680 | $33,460 |
| 2017 | $2,864 | $30,590 | $6,020 | $24,570 |
| 2016 | $2,883 | $30,590 | $6,020 | $24,570 |
| 2015 | $3,182 | $30,590 | $6,020 | $24,570 |
| 2014 | $3,182 | $36,860 | $7,250 | $29,610 |
Source: Public Records
Map
Nearby Homes
- 1301 Forest Hills Blvd
- 1231 Hereford Rd
- 1148 Rutherford Rd
- 1159 Brandon Rd
- 1111 Hereford Rd
- 3430 Mayfield Rd
- 3153 Eastwick Dr
- 1073 Hereford Rd
- 3491 Edison Rd
- 3142 Eastwick Dr
- 1403 Copper Trace Unit 407
- 1492 S Taylor Rd
- 1417 Slate Ct
- 2256 N Taylor Rd
- 2257 N Taylor Rd
- 3060 Chelsea Dr
- 1560 S Taylor Rd
- 2186 Mount Vernon Blvd
- 1558 Ivydale Rd
- 1602 Rydalmount Rd
- 3312 Chelsea Dr
- 3324 Chelsea Dr
- 3330 Chelsea Dr
- 1355 Forest Hills Blvd
- 3347 Hollister Rd
- 1365 Forest Hills Blvd
- 3353 Hollister Rd
- 1345 Forest Hills Blvd
- 3336 Chelsea Dr
- 3359 Hollister Rd
- 3319 Chelsea Dr
- 3325 Chelsea Dr
- 3313 Chelsea Dr
- 3333 Chelsea Dr
- 3363 Hollister Rd
- 3342 Chelsea Dr
- 3305 Chelsea Dr
- 3337 Chelsea Dr
- 3297 Chelsea Dr
- 3369 Hollister Rd