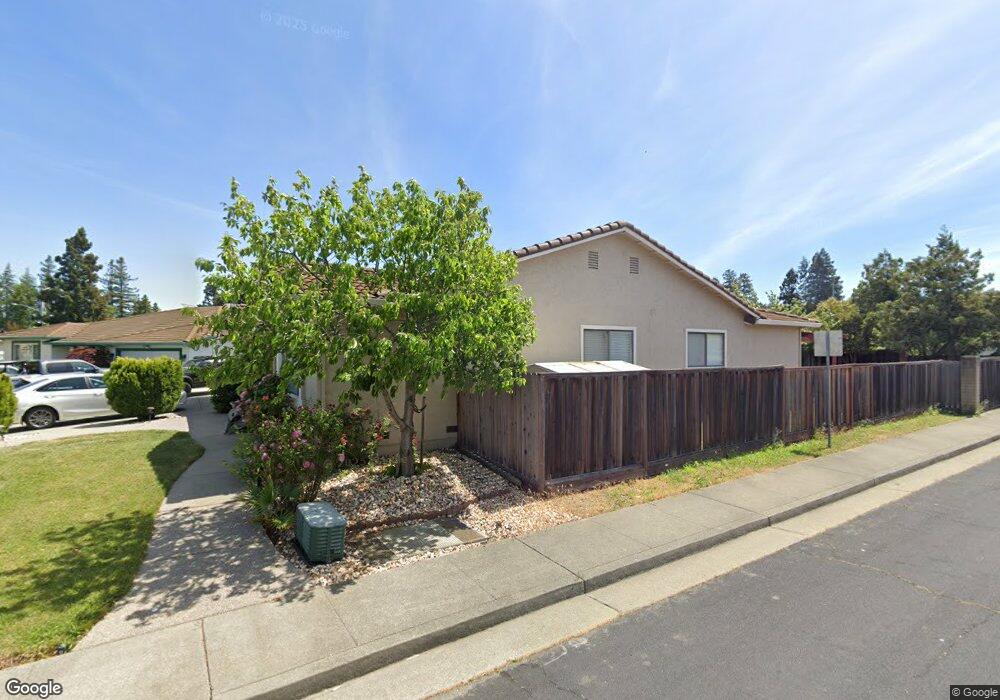
3318 El Pinole Way Fairfield, CA 94533
Estimated Value: $632,284 - $674,000
3
Beds
2
Baths
2,127
Sq Ft
$306/Sq Ft
Est. Value
About This Home
This home is located at 3318 El Pinole Way, Fairfield, CA 94533 and is currently estimated at $650,321, approximately $305 per square foot. 3318 El Pinole Way is a home located in Solano County with nearby schools including Rolling Hills Elementary School, Fairfield High School, and Fairfield Christian School.
Ownership History
Date
Name
Owned For
Owner Type
Purchase Details
Closed on
Oct 23, 2018
Sold by
Beligado Nestor
Bought by
Baligod Dianna C
Current Estimated Value
Home Financials for this Owner
Home Financials are based on the most recent Mortgage that was taken out on this home.
Original Mortgage
$230,000
Outstanding Balance
$172,875
Interest Rate
4.6%
Mortgage Type
New Conventional
Estimated Equity
$477,446
Purchase Details
Closed on
Nov 9, 2009
Sold by
Baligod Nestor and Baligod Dianna C
Bought by
Baligod Nestor and Baligod Dianna
Home Financials for this Owner
Home Financials are based on the most recent Mortgage that was taken out on this home.
Original Mortgage
$210,000
Interest Rate
4.83%
Mortgage Type
New Conventional
Purchase Details
Closed on
Dec 24, 1996
Sold by
Bennett George T
Bought by
Baligod Nestor and Baligod Dianna C
Home Financials for this Owner
Home Financials are based on the most recent Mortgage that was taken out on this home.
Original Mortgage
$157,500
Interest Rate
7.59%
Create a Home Valuation Report for This Property
The Home Valuation Report is an in-depth analysis detailing your home's value as well as a comparison with similar homes in the area
Home Values in the Area
Average Home Value in this Area
Purchase History
| Date | Buyer | Sale Price | Title Company |
|---|---|---|---|
| Baligod Dianna C | $125,909 | Old Republic Title Co | |
| Baligod Nestor | -- | North American Title Company | |
| Baligod Nestor | $175,000 | Placer Title Company |
Source: Public Records
Mortgage History
| Date | Status | Borrower | Loan Amount |
|---|---|---|---|
| Open | Baligod Dianna C | $230,000 | |
| Previous Owner | Baligod Nestor | $210,000 | |
| Previous Owner | Baligod Nestor | $157,500 |
Source: Public Records
Tax History Compared to Growth
Tax History
| Year | Tax Paid | Tax Assessment Tax Assessment Total Assessment is a certain percentage of the fair market value that is determined by local assessors to be the total taxable value of land and additions on the property. | Land | Improvement |
|---|---|---|---|---|
| 2025 | $3,118 | $285,015 | $97,719 | $187,296 |
| 2024 | $3,118 | $293,477 | $95,803 | $197,674 |
| 2023 | $3,020 | $273,949 | $93,925 | $180,024 |
| 2022 | $2,982 | $268,579 | $92,084 | $176,495 |
| 2021 | $2,952 | $263,314 | $90,279 | $173,035 |
| 2020 | $2,882 | $260,615 | $89,354 | $171,261 |
| 2019 | $2,810 | $255,505 | $87,602 | $167,903 |
| 2018 | $2,898 | $250,496 | $85,885 | $164,611 |
| 2017 | $2,763 | $245,585 | $84,201 | $161,384 |
| 2016 | $2,738 | $240,770 | $82,550 | $158,220 |
| 2015 | $2,555 | $237,155 | $81,311 | $155,844 |
| 2014 | $2,530 | $232,511 | $79,719 | $152,792 |
Source: Public Records
Map
Nearby Homes
- 2532 Cyan Dr
- 2462 Shore Vista Unit 4752
- 3265 Arroyo Dr
- 523 El Camino Dr
- 3101 Arroyo Ct
- 3276 Arroyo Dr
- 705 Otter Ct
- 675 Hillside Dr
- 743 Isabella Way
- 738 Marsh Place
- 727 Shamrock Ct
- 703 Mustang Ct
- 960 Suffolk Way
- 722 Rosemary Ct
- 558 Maywood Way
- 3087 Pecan Cir
- 2924 Redwood Dr
- 841 Walden Ct
- 1031 Suffolk Way
- 3442 Glen Ellen Dr
- 3320 El Pinole Way
- 3313 El Pinole Way
- 3307 El Pinole Way
- 3322 El Pinole Way
- 3319 El Pinole Way
- 3301 El Pinole Way
- 3326 El Pinole Way
- 3324 El Pinole Way
- 3228 Arroyo Dr
- 3232 Arroyo Dr
- 3224 Arroyo Dr
- 3325 El Pinole Way
- 3220 Arroyo Dr
- 3236 Arroyo Dr
- 3331 El Pinole Way
- 3216 Arroyo Dr
- 3240 Arroyo Dr
- 3244 Arroyo Dr
- 3233 Arroyo Dr