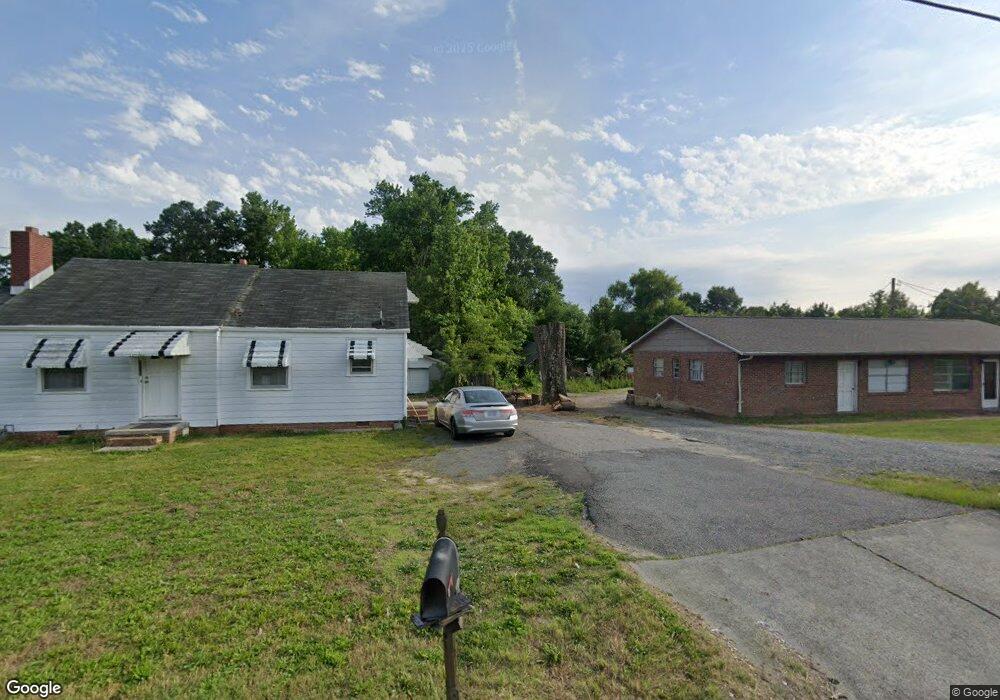
3318 Wake Forest Rd Durham, NC 27703
Eastern Durham NeighborhoodEstimated Value: $200,000 - $298,000
2
Beds
1
Bath
1,065
Sq Ft
$243/Sq Ft
Est. Value
About This Home
This home is located at 3318 Wake Forest Rd, Durham, NC 27703 and is currently estimated at $259,055, approximately $243 per square foot. 3318 Wake Forest Rd is a home located in Durham County with nearby schools including Oak Grove Elementary, John W Neal Middle School, and Southern School of Energy & Sustainability.
Ownership History
Date
Name
Owned For
Owner Type
Purchase Details
Closed on
Jun 30, 2016
Sold by
Self Help Cr Un
Bought by
Mnb Properties Llc
Current Estimated Value
Purchase Details
Closed on
Mar 16, 2016
Sold by
Ortiz Bellarosa Nunez
Bought by
Help Cr Un
Purchase Details
Closed on
Sep 7, 2012
Sold by
Turlington Jamie Poole and Turlington James Ryan
Bought by
Ortiz Bellarosa Nunez and Hernandezcalderon Rene
Purchase Details
Closed on
Sep 28, 2007
Sold by
Turlington Jamie Poole and Turlington James Ryan
Bought by
Ortiz Bellarosa Nunez and Hernandez Calderon Rene
Home Financials for this Owner
Home Financials are based on the most recent Mortgage that was taken out on this home.
Original Mortgage
$76,000
Interest Rate
6.57%
Mortgage Type
Purchase Money Mortgage
Purchase Details
Closed on
Aug 22, 2006
Sold by
Cash Linwood R and Cavalchire Faye C
Bought by
Cavalchire Faye C
Create a Home Valuation Report for This Property
The Home Valuation Report is an in-depth analysis detailing your home's value as well as a comparison with similar homes in the area
Home Values in the Area
Average Home Value in this Area
Purchase History
| Date | Buyer | Sale Price | Title Company |
|---|---|---|---|
| Mnb Properties Llc | $64,000 | -- | |
| Help Cr Un | $77,000 | -- | |
| Ortiz Bellarosa Nunez | -- | None Available | |
| Ortiz Bellarosa Nunez | -- | None Available | |
| Ortiz Bellarosa Nunez | $80,000 | None Available | |
| Cavalchire Faye C | -- | None Available | |
| Poole Jamie R | -- | None Available |
Source: Public Records
Mortgage History
| Date | Status | Borrower | Loan Amount |
|---|---|---|---|
| Previous Owner | Ortiz Bellarosa Nunez | $76,000 |
Source: Public Records
Tax History Compared to Growth
Tax History
| Year | Tax Paid | Tax Assessment Tax Assessment Total Assessment is a certain percentage of the fair market value that is determined by local assessors to be the total taxable value of land and additions on the property. | Land | Improvement |
|---|---|---|---|---|
| 2025 | $1,738 | $229,304 | $97,500 | $131,804 |
| 2024 | $1,459 | $130,205 | $37,525 | $92,680 |
| 2023 | $1,402 | $130,205 | $37,525 | $92,680 |
| 2022 | $1,355 | $130,205 | $37,525 | $92,680 |
| 2021 | $1,142 | $130,205 | $37,525 | $92,680 |
| 2020 | $1,116 | $130,205 | $37,525 | $92,680 |
| 2019 | $1,103 | $130,205 | $37,525 | $92,680 |
| 2018 | $965 | $104,586 | $30,020 | $74,566 |
| 2017 | $934 | $104,586 | $30,020 | $74,566 |
| 2016 | $905 | $104,586 | $30,020 | $74,566 |
| 2015 | $920 | $84,594 | $28,701 | $55,893 |
| 2014 | $924 | $84,594 | $28,701 | $55,893 |
Source: Public Records
Map
Nearby Homes
- 650 Ganyard Farm Way Unit 6
- 650 Ganyard Farm Way Unit 5
- 102 Harvest Oaks Ln Unit 38
- 210 Stoney Creek Cir
- 4 Hertford Place
- 1008 Shovelhead Dr Unit 55
- 607 Chopper Ln Unit Homesite 9
- 1007 Shovelhead Dr Unit 4
- 2018 Cross Bones Blvd
- 2018 Cross Bones Blvd Unit 28
- 1101 Shovelhead Dr Unit 51
- 308 Lynn Rd
- 322+326 Chandler Rd
- 506 Currin St
- 118 Lynn Rd
- 903 Outlaw Ave Unit Homesite 21
- 3323 Nantuckett Ave
- 3330 Nantuckett Ave
- 3533 Gibson Rd
- 740 Obsidian Way
- 3318 Holloway St
- 3320 Holloway St
- 3316 Holloway St
- 3313 Holloway St
- 8109 N Carolina 98
- 3315 Holloway St
- 3324 Wake Forest Hwy
- 3311 Holloway St
- 650 Ganyard Farm Way Unit 16
- 650 Ganyard Farm Way Unit 14
- 3332 Holloway St
- 53 Clayton Rd
- 41 Clayton Rd
- 26 Clayton Rd
- 14 Clayton Rd
- 3303 Wake Forest Hwy
- 650 Ganyard Farm Way Unit 39
- 650 Ganyard Farm Way Unit 3
- 650 Ganyard Farm Way Unit 11
- 650 Ganyard Farm Way Unit 23