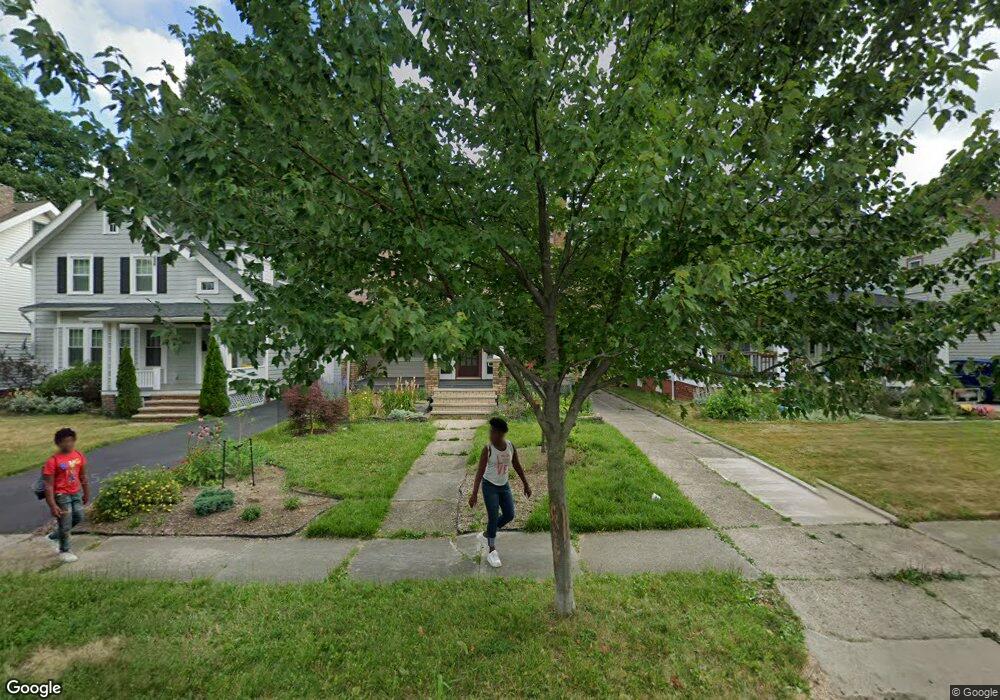
3319 Altamont Ave Cleveland, OH 44118
Estimated Value: $178,865 - $211,000
3
Beds
2
Baths
1,827
Sq Ft
$106/Sq Ft
Est. Value
About This Home
This home is located at 3319 Altamont Ave, Cleveland, OH 44118 and is currently estimated at $193,466, approximately $105 per square foot. 3319 Altamont Ave is a home located in Cuyahoga County with nearby schools including Boulevard Elementary School, Roxboro Middle School, and Cleveland Heights High School.
Ownership History
Date
Name
Owned For
Owner Type
Purchase Details
Closed on
Oct 25, 2005
Sold by
Yancy Constance M
Bought by
Laguardia Jonathan R and Miklowski Sonya M
Current Estimated Value
Home Financials for this Owner
Home Financials are based on the most recent Mortgage that was taken out on this home.
Original Mortgage
$121,200
Outstanding Balance
$65,430
Interest Rate
5.8%
Mortgage Type
Purchase Money Mortgage
Estimated Equity
$128,036
Purchase Details
Closed on
Oct 6, 1993
Sold by
Lawrence Rouse
Bought by
Yancy Constance M
Purchase Details
Closed on
Jan 14, 1982
Sold by
Rouse Lawrence H
Bought by
Lawrence Rouse
Purchase Details
Closed on
Nov 28, 1979
Sold by
Wilson Franklin D and Wilson Charlene
Bought by
Rouse Lawrence H
Purchase Details
Closed on
Oct 20, 1975
Sold by
Ruschell James M and Ruschell Caroline
Bought by
Wilson Franklin D and Wilson Charlene
Purchase Details
Closed on
Jan 1, 1975
Bought by
Ruschell James M and Ruschell Caroline
Create a Home Valuation Report for This Property
The Home Valuation Report is an in-depth analysis detailing your home's value as well as a comparison with similar homes in the area
Home Values in the Area
Average Home Value in this Area
Purchase History
| Date | Buyer | Sale Price | Title Company |
|---|---|---|---|
| Laguardia Jonathan R | $125,000 | Land Title Agency | |
| Yancy Constance M | $68,900 | -- | |
| Lawrence Rouse | -- | -- | |
| Rouse Lawrence H | $46,400 | -- | |
| Wilson Franklin D | $21,400 | -- | |
| Ruschell James M | -- | -- |
Source: Public Records
Mortgage History
| Date | Status | Borrower | Loan Amount |
|---|---|---|---|
| Open | Laguardia Jonathan R | $121,200 |
Source: Public Records
Tax History Compared to Growth
Tax History
| Year | Tax Paid | Tax Assessment Tax Assessment Total Assessment is a certain percentage of the fair market value that is determined by local assessors to be the total taxable value of land and additions on the property. | Land | Improvement |
|---|---|---|---|---|
| 2024 | $4,146 | $48,720 | $10,885 | $37,835 |
| 2023 | $3,862 | $35,420 | $9,520 | $25,900 |
| 2022 | $4,259 | $39,340 | $9,520 | $29,820 |
| 2021 | $4,173 | $39,340 | $9,520 | $29,820 |
| 2020 | $3,730 | $31,710 | $7,670 | $24,050 |
| 2019 | $3,524 | $90,600 | $21,900 | $68,700 |
| 2018 | $3,654 | $31,710 | $7,670 | $24,050 |
| 2017 | $3,045 | $25,380 | $7,210 | $18,170 |
| 2016 | $3,989 | $33,530 | $7,210 | $26,320 |
| 2015 | $4,059 | $33,530 | $7,210 | $26,320 |
| 2014 | $4,059 | $36,060 | $7,740 | $28,320 |
Source: Public Records
Map
Nearby Homes
- 3326 Beechwood Ave
- 3320 Beechwood Ave
- 3328 Altamont Ave
- 3314 Altamont Ave
- 3356 Euclid Heights Blvd
- 3365 Desota Ave
- 3388 Beechwood Ave Unit 2
- 3383 Beechwood Ave
- 3264 Altamont Ave
- 3263 Desota Ave
- 3412 Euclid Heights Blvd
- 3246 Altamont Ave
- 3423 Beechwood Ave
- 1659 Ivydale Rd
- 1683 Colonial Dr
- 3215 Euclid Heights Blvd
- 3235 Oak Rd
- 3483 Severn Rd
- 1602 Rydalmount Rd
- 3165 Oak Rd
- 3323 Altamont Ave
- 3315 Altamont Ave
- 3327 Altamont Ave
- 3311 Altamont Ave
- 3331 Altamont Ave
- 3307 Altamont Ave
- 3314 Beechwood Ave
- 3322 Beechwood Ave
- 3303 Altamont Ave
- 3335 Altamont Ave
- 3308 Beechwood Ave
- 3324 Beechwood Ave
- 3322 Altamont Ave
- 3304 Beechwood Ave
- 3324 Altamont Ave
- 3299 Altamont Ave
- 3339 Altamont Ave
- 3310 Altamont Ave
- 3300 Beechwood Ave
- 3304 Altamont Ave