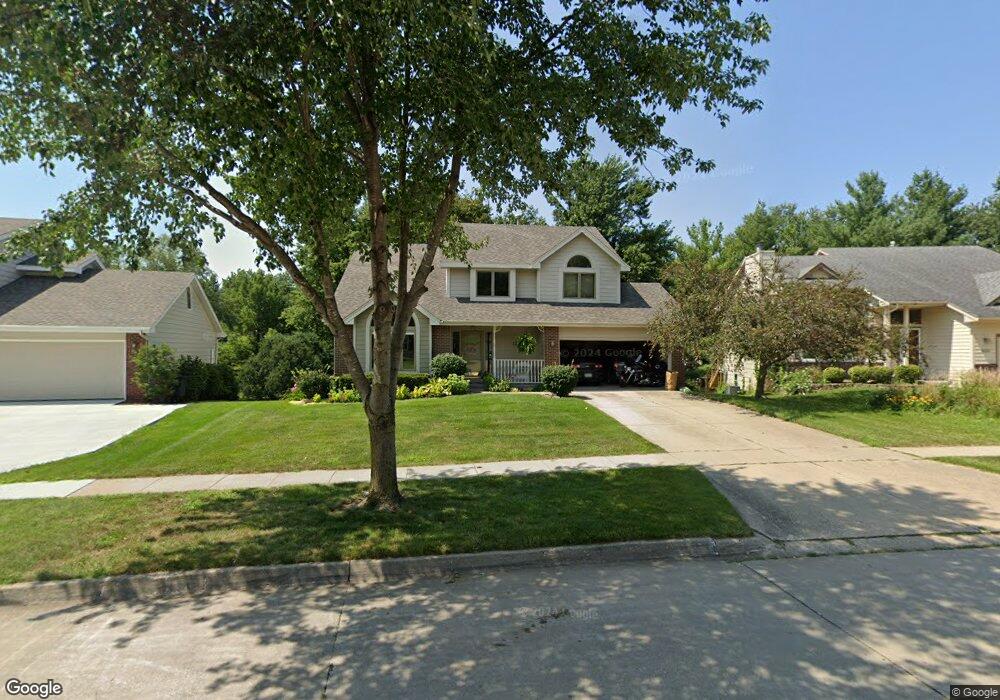
332 31st St West Des Moines, IA 50265
Estimated Value: $360,000 - $431,000
4
Beds
3
Baths
2,174
Sq Ft
$184/Sq Ft
Est. Value
About This Home
This home is located at 332 31st St, West Des Moines, IA 50265 and is currently estimated at $400,180, approximately $184 per square foot. 332 31st St is a home located in Polk County with nearby schools including Fairmeadows Elementary School, Stilwell Junior High School, and Valley Southwoods Freshman High School.
Ownership History
Date
Name
Owned For
Owner Type
Purchase Details
Closed on
Apr 21, 1997
Sold by
Wheeler Michael L and Wheeler Roberta M
Bought by
Arganbright James M and Arganbright Julie A
Current Estimated Value
Home Financials for this Owner
Home Financials are based on the most recent Mortgage that was taken out on this home.
Original Mortgage
$145,800
Interest Rate
7.92%
Create a Home Valuation Report for This Property
The Home Valuation Report is an in-depth analysis detailing your home's value as well as a comparison with similar homes in the area
Home Values in the Area
Average Home Value in this Area
Purchase History
| Date | Buyer | Sale Price | Title Company |
|---|---|---|---|
| Arganbright James M | $161,500 | -- |
Source: Public Records
Mortgage History
| Date | Status | Borrower | Loan Amount |
|---|---|---|---|
| Closed | Arganbright James M | $15,500 | |
| Open | Arganbright James M | $172,000 | |
| Closed | Arganbright James M | $79,270 | |
| Closed | Arganbright James M | $100,000 | |
| Closed | Arganbright James M | $40,000 | |
| Closed | Arganbright James M | $145,800 |
Source: Public Records
Tax History Compared to Growth
Tax History
| Year | Tax Paid | Tax Assessment Tax Assessment Total Assessment is a certain percentage of the fair market value that is determined by local assessors to be the total taxable value of land and additions on the property. | Land | Improvement |
|---|---|---|---|---|
| 2024 | $6,194 | $408,300 | $74,900 | $333,400 |
| 2023 | $6,120 | $408,300 | $74,900 | $333,400 |
| 2022 | $6,046 | $325,800 | $61,400 | $264,400 |
| 2021 | $6,062 | $325,800 | $61,400 | $264,400 |
| 2020 | $5,968 | $310,900 | $58,500 | $252,400 |
| 2019 | $5,664 | $310,900 | $58,500 | $252,400 |
| 2018 | $5,672 | $285,000 | $52,700 | $232,300 |
| 2017 | $5,306 | $285,000 | $52,700 | $232,300 |
| 2016 | $5,186 | $259,500 | $47,400 | $212,100 |
| 2015 | $5,186 | $259,500 | $47,400 | $212,100 |
| 2014 | $4,534 | $232,500 | $41,600 | $190,900 |
Source: Public Records
Map
Nearby Homes
- 308 33rd St
- 305 31st St
- 320 33rd St
- 509 29th Ct
- 2729 Meadow Point Ct
- 125 29th Ct
- 3305 Ep True Pkwy Unit 1302
- 124 25th Ct
- 2801 Ep True Pkwy Unit 201
- 205 S 29th St
- 2300 Locust St
- 608 34th St
- 3723 Oak Creek Place
- 713 32nd St
- 2217 Meadow Ln
- 711 36th St
- 2021 Elm Cir
- 504 21st St
- 3204 Vine St
- 2006 Maple Cir