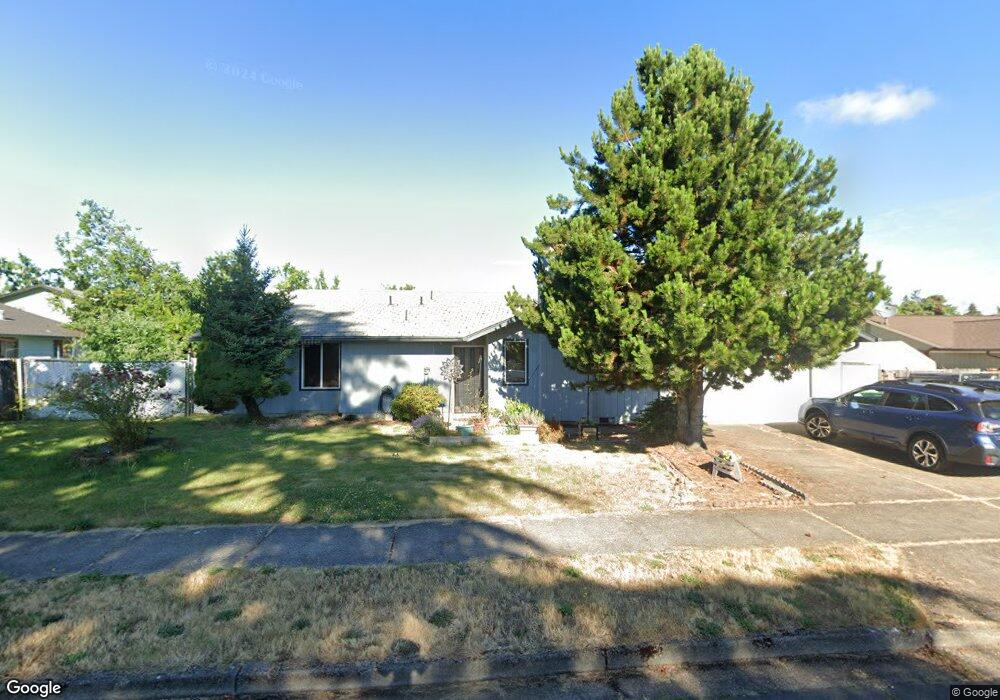
332 49th Loop Springfield, OR 97478
East Springfield NeighborhoodEstimated Value: $395,771 - $436,000
3
Beds
2
Baths
1,355
Sq Ft
$303/Sq Ft
Est. Value
About This Home
This home is located at 332 49th Loop, Springfield, OR 97478 and is currently estimated at $409,943, approximately $302 per square foot. 332 49th Loop is a home located in Lane County with nearby schools including Riverbend Elementary School, Agnes Stewart Middle School, and Thurston High School.
Ownership History
Date
Name
Owned For
Owner Type
Purchase Details
Closed on
Mar 10, 2008
Sold by
Broomall William A and Broomall Kimberly M
Bought by
Brim Sharon S
Current Estimated Value
Home Financials for this Owner
Home Financials are based on the most recent Mortgage that was taken out on this home.
Original Mortgage
$216,950
Outstanding Balance
$133,261
Interest Rate
5.65%
Mortgage Type
Purchase Money Mortgage
Estimated Equity
$276,682
Purchase Details
Closed on
Aug 9, 2001
Sold by
Jeans Earl C and Jeans Doris E
Bought by
Broomall William A and Broomall Kimberly M
Home Financials for this Owner
Home Financials are based on the most recent Mortgage that was taken out on this home.
Original Mortgage
$125,200
Interest Rate
7.1%
Mortgage Type
FHA
Create a Home Valuation Report for This Property
The Home Valuation Report is an in-depth analysis detailing your home's value as well as a comparison with similar homes in the area
Home Values in the Area
Average Home Value in this Area
Purchase History
| Date | Buyer | Sale Price | Title Company |
|---|---|---|---|
| Brim Sharon S | $216,950 | First American Title | |
| Broomall William A | $127,000 | Evergreen Land Title Co |
Source: Public Records
Mortgage History
| Date | Status | Borrower | Loan Amount |
|---|---|---|---|
| Open | Brim Sharon S | $216,950 | |
| Previous Owner | Broomall William A | $125,200 |
Source: Public Records
Tax History
| Year | Tax Paid | Tax Assessment Tax Assessment Total Assessment is a certain percentage of the fair market value that is determined by local assessors to be the total taxable value of land and additions on the property. | Land | Improvement |
|---|---|---|---|---|
| 2025 | $3,882 | $211,715 | -- | -- |
| 2024 | $3,819 | $205,549 | -- | -- |
| 2023 | $3,819 | $199,563 | $0 | $0 |
| 2022 | $3,537 | $193,751 | $0 | $0 |
| 2021 | $3,474 | $188,108 | $0 | $0 |
| 2020 | $3,373 | $182,630 | $0 | $0 |
| 2019 | $3,271 | $177,311 | $0 | $0 |
| 2018 | $3,084 | $167,133 | $0 | $0 |
| 2017 | $2,965 | $167,133 | $0 | $0 |
| 2016 | $2,903 | $162,265 | $0 | $0 |
| 2015 | $2,820 | $157,539 | $0 | $0 |
| 2014 | $2,777 | $152,950 | $0 | $0 |
Source: Public Records
Map
Nearby Homes
- 0 N St
- 422 S 49th Place
- 503 S 51st Place
- 340 54th St
- 4973 Forsythia St
- 569 S 51st Place
- 5495 A Units 69 70 71 72 St
- 4733 Union Terrace
- 5210 Holly St
- 5259 Holly St
- 5024 Cedar View Dr
- 4908 Holly St
- 733 54th St
- 775 54th St
- 205 S 54th (#11) St Unit 11
- 4680 Glacier Meadows Loop
- 5335 Main St Unit 236
- 5335 Main St
- 5335 Main St Unit 184
- 5335 Main St Unit 197
Your Personal Tour Guide
Ask me questions while you tour the home.