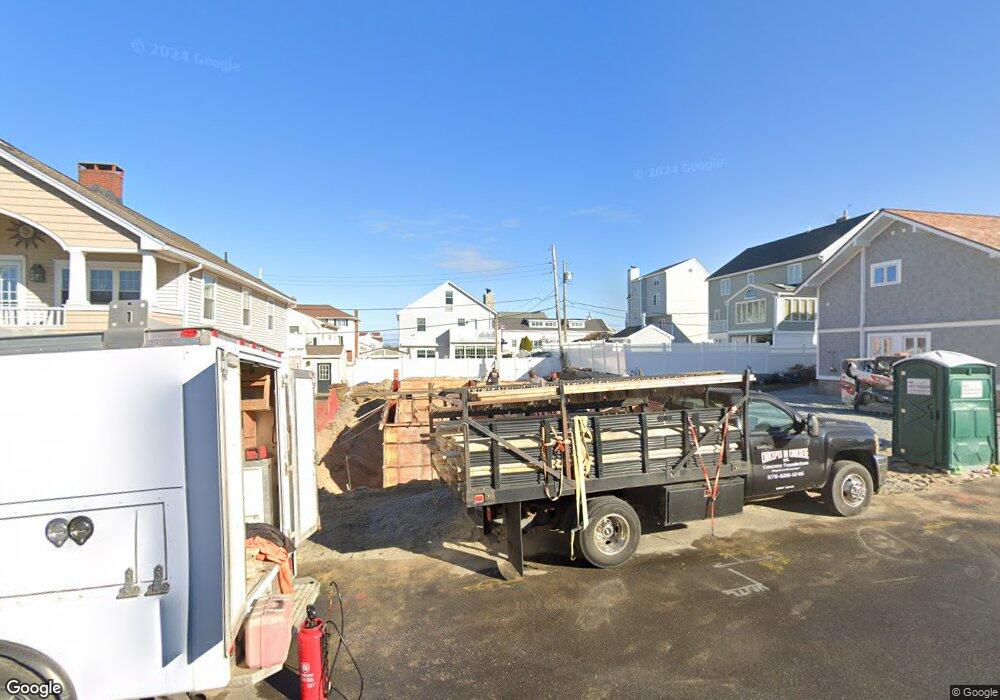
332 Ashland St Seabrook, NH 03874
Seabrook Beach NeighborhoodEstimated Value: $1,230,770 - $1,535,000
3
Beds
2
Baths
1,816
Sq Ft
$770/Sq Ft
Est. Value
About This Home
This home is located at 332 Ashland St, Seabrook, NH 03874 and is currently estimated at $1,399,193, approximately $770 per square foot. 332 Ashland St is a home located in Rockingham County with nearby schools including Hampton Centre School, Adeline C. Marston Elementary School, and Hampton Academy.
Ownership History
Date
Name
Owned For
Owner Type
Purchase Details
Closed on
Dec 19, 2024
Sold by
Mercuri George F and Mercuri Christina
Bought by
Mercuri Ft and Mercuri
Current Estimated Value
Purchase Details
Closed on
Mar 7, 2008
Sold by
Denuzzio Ft
Bought by
Mercuri George F and Mercuri Christina
Home Financials for this Owner
Home Financials are based on the most recent Mortgage that was taken out on this home.
Original Mortgage
$417,000
Interest Rate
5.57%
Mortgage Type
Purchase Money Mortgage
Create a Home Valuation Report for This Property
The Home Valuation Report is an in-depth analysis detailing your home's value as well as a comparison with similar homes in the area
Home Values in the Area
Average Home Value in this Area
Purchase History
| Date | Buyer | Sale Price | Title Company |
|---|---|---|---|
| Mercuri Ft | -- | None Available | |
| Mercuri George F | $610,000 | -- | |
| Mercuri George F | $610,000 | -- |
Source: Public Records
Mortgage History
| Date | Status | Borrower | Loan Amount |
|---|---|---|---|
| Previous Owner | Mercuri George F | $397,036 | |
| Previous Owner | Mercuri George F | $417,000 |
Source: Public Records
Tax History Compared to Growth
Tax History
| Year | Tax Paid | Tax Assessment Tax Assessment Total Assessment is a certain percentage of the fair market value that is determined by local assessors to be the total taxable value of land and additions on the property. | Land | Improvement |
|---|---|---|---|---|
| 2024 | $13,126 | $1,120,000 | $870,900 | $249,100 |
| 2023 | $13,148 | $871,300 | $679,700 | $191,600 |
| 2022 | $11,545 | $871,300 | $679,700 | $191,600 |
| 2021 | $11,963 | $871,300 | $679,700 | $191,600 |
| 2020 | $10,844 | $679,000 | $516,800 | $162,200 |
| 2019 | $10,694 | $679,000 | $516,800 | $162,200 |
| 2018 | $10,662 | $656,100 | $493,900 | $162,200 |
| 2017 | $10,002 | $615,500 | $453,300 | $162,200 |
| 2016 | $9,088 | $614,500 | $453,300 | $161,200 |
| 2015 | $7,688 | $519,800 | $374,600 | $145,200 |
| 2014 | $7,659 | $501,600 | $356,400 | $145,200 |
| 2013 | $7,659 | $501,600 | $356,400 | $145,200 |
Source: Public Records
Map
Nearby Homes
- 376 Ocean Blvd
- 9 Tyngsboro St
- 18 River St
- 13-15 Ocean Blvd
- 13 Ocean Blvd
- 15 Ocean Blvd
- 3 Harris Ave
- 5 Fellows Ave
- 27 Cross Beach Rd
- 10 Haverhill Ave Unit 1
- 10 Haverhill Ave Unit 2
- 19 Riverview Terrace
- 17 Johnson Ave
- 7 Perkins Ave
- 3 Perkins Ave Unit 2
- 3 Perkins Ave Unit 1
- 27 Perkins Ave
- 22 Perkins Ave
- 128 Ashworth Ave Unit 303
- 27 Hobson Ave
- 331 Ashland St
- 331 Ashland St Unit 2
- 64 Ocean Dr
- 52 Ocean Dr
- 330 Ashland St
- 76 Woodstock St
- 72 Woodstock St
- 222 Ashland St
- 260 Ashland St
- 259 Ashland St
- 258 Ashland St
- 329 Ashland St
- 68 Ocean Dr
- 336 Woodstock St
- 257 Ashland St
- 337 Woodstock St
- 72 Ocean Dr
- 75 Woodstock St
- 256 Ashland St
- 223 Bristol St