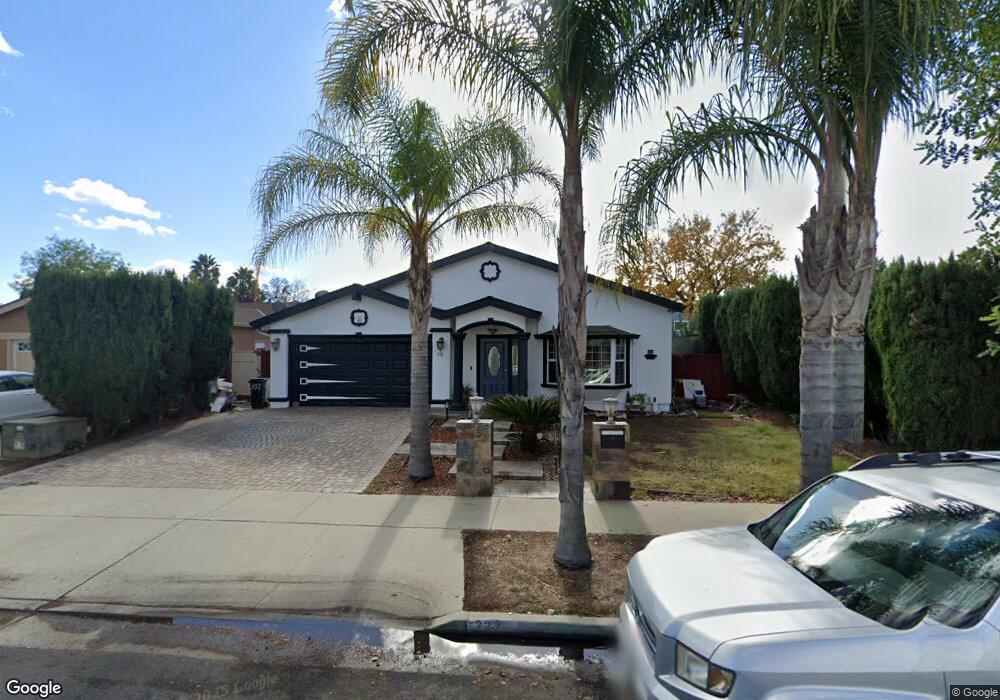
332 Avenida Pinos San Jose, CA 95123
Del Robles NeighborhoodEstimated Value: $1,434,000 - $1,527,065
4
Beds
2
Baths
1,340
Sq Ft
$1,104/Sq Ft
Est. Value
About This Home
This home is located at 332 Avenida Pinos, San Jose, CA 95123 and is currently estimated at $1,479,266, approximately $1,103 per square foot. 332 Avenida Pinos is a home located in Santa Clara County with nearby schools including Del Roble Elementary School, Herman (Leonard) Intermediate School, and Santa Teresa High School.
Ownership History
Date
Name
Owned For
Owner Type
Purchase Details
Closed on
May 16, 2018
Sold by
Jimenez Nidia Socorro
Bought by
Jimenez Nidia Socorro and Olvera Jazarty N
Current Estimated Value
Home Financials for this Owner
Home Financials are based on the most recent Mortgage that was taken out on this home.
Original Mortgage
$500,000
Outstanding Balance
$431,504
Interest Rate
4.5%
Mortgage Type
New Conventional
Estimated Equity
$1,047,762
Purchase Details
Closed on
Mar 5, 2001
Sold by
Vega Alejandro
Bought by
Jimenez Nidia Socorro
Home Financials for this Owner
Home Financials are based on the most recent Mortgage that was taken out on this home.
Original Mortgage
$368,000
Interest Rate
8.76%
Purchase Details
Closed on
Feb 28, 2001
Sold by
Karim Ivan and Karim Romina
Bought by
Jimenez Nidia Socorro
Home Financials for this Owner
Home Financials are based on the most recent Mortgage that was taken out on this home.
Original Mortgage
$368,000
Interest Rate
8.76%
Create a Home Valuation Report for This Property
The Home Valuation Report is an in-depth analysis detailing your home's value as well as a comparison with similar homes in the area
Home Values in the Area
Average Home Value in this Area
Purchase History
| Date | Buyer | Sale Price | Title Company |
|---|---|---|---|
| Jimenez Nidia Socorro | $250,000 | Title365 | |
| Jimenez Nidia Socorro | -- | First American Title Guarant | |
| Jimenez Nidia Socorro | $460,000 | First American Title Guarant |
Source: Public Records
Mortgage History
| Date | Status | Borrower | Loan Amount |
|---|---|---|---|
| Open | Jimenez Nidia Socorro | $500,000 | |
| Previous Owner | Jimenez Nidia Socorro | $368,000 |
Source: Public Records
Tax History Compared to Growth
Tax History
| Year | Tax Paid | Tax Assessment Tax Assessment Total Assessment is a certain percentage of the fair market value that is determined by local assessors to be the total taxable value of land and additions on the property. | Land | Improvement |
|---|---|---|---|---|
| 2025 | $10,867 | $772,169 | $381,218 | $390,951 |
| 2024 | $10,867 | $757,030 | $373,744 | $383,286 |
| 2023 | $10,695 | $742,187 | $366,416 | $375,771 |
| 2022 | $10,629 | $727,635 | $359,232 | $368,403 |
| 2021 | $10,469 | $713,369 | $352,189 | $361,180 |
| 2020 | $10,237 | $899,222 | $590,445 | $308,777 |
| 2019 | $12,413 | $881,591 | $578,868 | $302,723 |
| 2018 | $10,018 | $678,641 | $335,044 | $343,597 |
| 2017 | $9,885 | $665,335 | $328,475 | $336,860 |
| 2016 | $9,407 | $652,290 | $322,035 | $330,255 |
| 2015 | $9,194 | $642,493 | $317,198 | $325,295 |
| 2014 | $8,436 | $629,908 | $310,985 | $318,923 |
Source: Public Records
Map
Nearby Homes
- 5330 Avenida Almendros
- 5459 Entrada Cedros
- 236 Cheris Dr
- 5296 Borneo Cir Unit 37
- 224 Cheris Dr
- 303 Tradewinds Dr Unit 10
- 309 Tradewinds Dr Unit 3
- 291 Tradewinds Dr Unit 7
- 5384 Duesenberg Dr
- 405 Don Carlos Ct
- 310 Tradewinds Dr Unit 8
- 285 Tradewinds Dr Unit 6
- 5504 Don Marcello Ct
- 5439 Colony Green Dr
- 5455 Don Mateo Ct
- 5368 Colony Park Cir Unit 258
- 469 Velasco Dr
- 224 Coy Dr Unit 1
- 5486 Tradewinds Walkway Unit 1
- 4824 Rue Calais
- 328 Avenida Pinos
- 334 Avenida Pinos
- 329 Avenida Nogales
- 336 Avenida Pinos
- 324 Avenida Pinos
- 327 Avenida Nogales
- 331 Avenida Nogales
- 325 Avenida Nogales
- 333 Avenida Nogales
- 333 Avenida Pinos
- 335 Avenida Pinos
- 329 Avenida Pinos
- 338 Avenida Pinos
- 322 Avenida Pinos
- 323 Avenida Nogales
- 337 Avenida Pinos
- 325 Avenida Pinos
- 335 Avenida Nogales
- 340 Avenida Pinos
- 320 Avenida Pinos