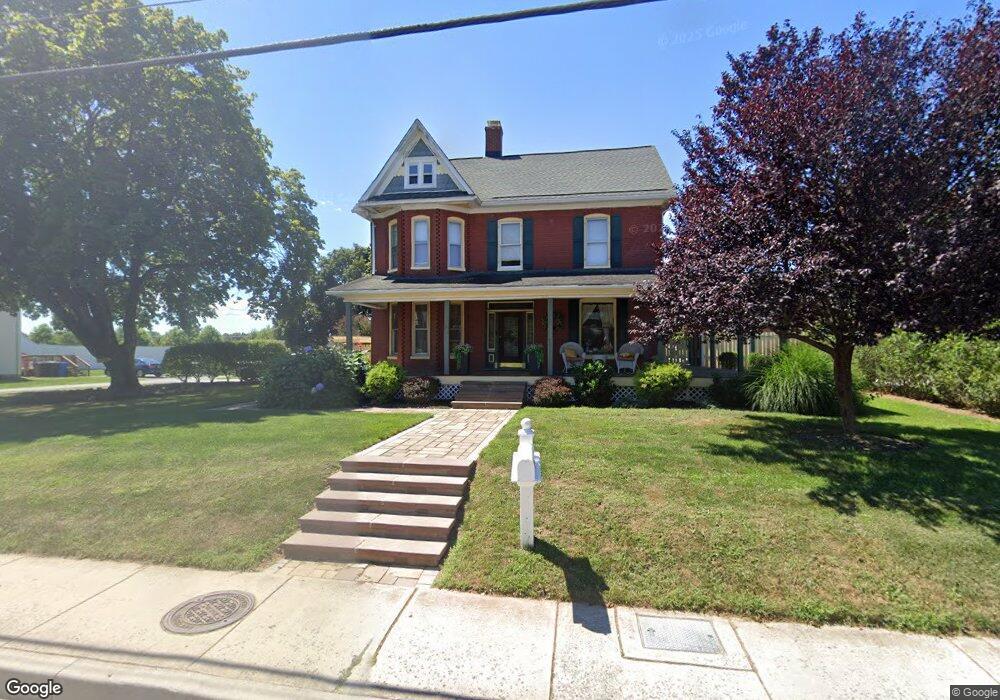
332 E Baltimore St Taneytown, MD 21787
Estimated Value: $390,000 - $435,687
Studio
3
Baths
3,120
Sq Ft
$132/Sq Ft
Est. Value
About This Home
This home is located at 332 E Baltimore St, Taneytown, MD 21787 and is currently estimated at $412,672, approximately $132 per square foot. 332 E Baltimore St is a home located in Carroll County with nearby schools including Taneytown Elementary School, Northwest Middle School, and Francis Scott Key High School.
Ownership History
Date
Name
Owned For
Owner Type
Purchase Details
Closed on
Dec 23, 2013
Sold by
Maring Robert
Bought by
Maring Robert and Furbay Maring Laura Elliot
Current Estimated Value
Home Financials for this Owner
Home Financials are based on the most recent Mortgage that was taken out on this home.
Original Mortgage
$268,500
Outstanding Balance
$200,923
Interest Rate
4.24%
Mortgage Type
VA
Estimated Equity
$211,749
Purchase Details
Closed on
Oct 18, 2004
Sold by
Furbay Christopher C
Bought by
Maring Robert
Purchase Details
Closed on
Jun 26, 2001
Sold by
Small James M
Bought by
Furbay Christopher C and Furbay Laura J
Purchase Details
Closed on
Jun 23, 1994
Sold by
Small E Y
Bought by
Small James M
Home Financials for this Owner
Home Financials are based on the most recent Mortgage that was taken out on this home.
Original Mortgage
$85,000
Interest Rate
8.74%
Create a Home Valuation Report for This Property
The Home Valuation Report is an in-depth analysis detailing your home's value as well as a comparison with similar homes in the area
Purchase History
| Date | Buyer | Sale Price | Title Company |
|---|---|---|---|
| Maring Robert | -- | Champion Title & Settlements | |
| Maring Robert | $235,000 | -- | |
| Furbay Christopher C | $165,000 | -- | |
| Small James M | $95,000 | -- |
Source: Public Records
Mortgage History
| Date | Status | Borrower | Loan Amount |
|---|---|---|---|
| Open | Maring Robert | $268,500 | |
| Previous Owner | Small James M | $85,000 |
Source: Public Records
Tax History
| Year | Tax Paid | Tax Assessment Tax Assessment Total Assessment is a certain percentage of the fair market value that is determined by local assessors to be the total taxable value of land and additions on the property. | Land | Improvement |
|---|---|---|---|---|
| 2025 | $4,082 | $294,500 | $0 | $0 |
| 2024 | $3,826 | $267,700 | $0 | $0 |
| 2023 | $3,589 | $240,900 | $88,900 | $152,000 |
| 2022 | $3,529 | $236,867 | $0 | $0 |
| 2021 | $6,985 | $232,833 | $0 | $0 |
| 2020 | $3,432 | $228,800 | $88,900 | $139,900 |
| 2019 | $3,384 | $225,600 | $0 | $0 |
| 2018 | $3,313 | $222,400 | $0 | $0 |
| 2017 | $3,266 | $219,200 | $0 | $0 |
| 2016 | -- | $219,200 | $0 | $0 |
| 2015 | -- | $219,200 | $0 | $0 |
| 2014 | -- | $219,200 | $0 | $0 |
Source: Public Records
Map
Nearby Homes
- 316 Taney Dr
- 3 Courtland St
- 428 E Baltimore St
- 430 E Baltimore St
- 411 Clover Ct
- 545 Daisy Dr
- 19 Fairground Ave
- 26 O Brien Ave
- 71 Fairground Ave
- 0 Carnival Dr
- 7 Zephyr Ct
- 10 Starboard Ct
- 105 Ridge Ave
- 547 Kenan St
- 101 Butterfly Dr
- 102 Butterfly Dr
- 205 Ridge Ave
- 4315 Stumptown Rd
- 525 Bull Run Rd
- 8 Hayride Ln
- 328 E Baltimore St
- 334 E Baltimore St
- 331 E Baltimore St
- 336 E Baltimore St
- 329 E Baltimore St
- 324 E Baltimore St
- 338 E Baltimore St
- 540 Trevanion Terrace
- 325 E Baltimore St
- 542 Trevanion Terrace
- 335 E Baltimore St
- 538 Trevanion Terrace
- 339 E Baltimore St
- 337 E Baltimore St
- 322 E Baltimore St
- 340 E Baltimore St
- 544 Trevanion Terrace
- 536 Trevanion Terrace
- 320 E Baltimore St
- 343 E Baltimore St