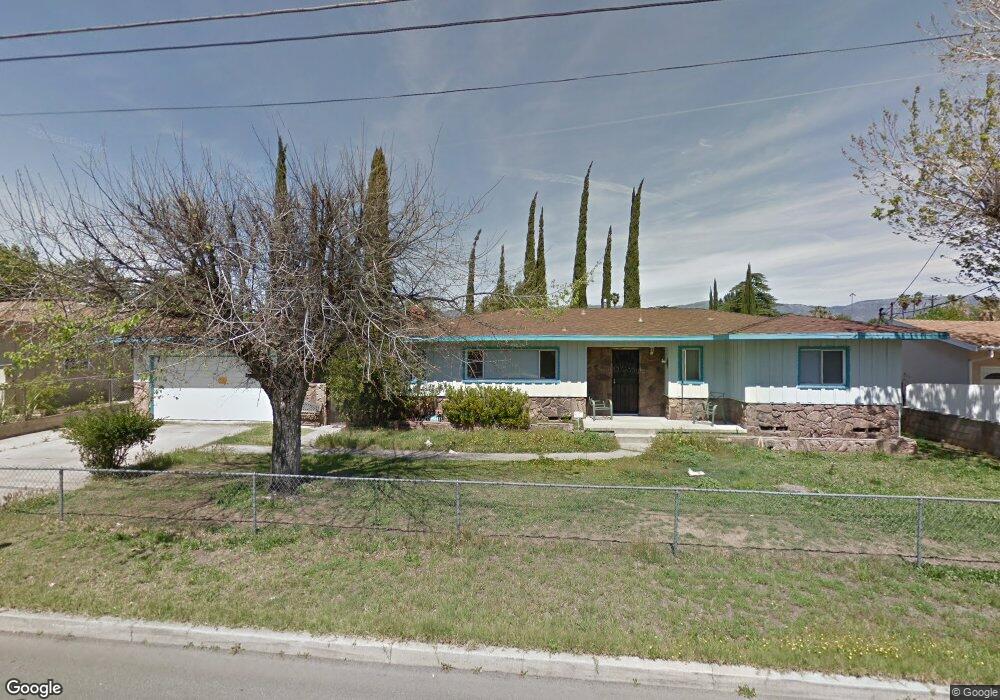
332 E Shamrock St Rialto, CA 92376
Estimated Value: $535,000 - $604,000
3
Beds
2
Baths
1,665
Sq Ft
$343/Sq Ft
Est. Value
About This Home
This home is located at 332 E Shamrock St, Rialto, CA 92376 and is currently estimated at $570,676, approximately $342 per square foot. 332 E Shamrock St is a home located in San Bernardino County with nearby schools including Henry Elementary School, Frisbie Middle School, and Eisenhower High School.
Ownership History
Date
Name
Owned For
Owner Type
Purchase Details
Closed on
Aug 22, 2008
Sold by
Sanchez Ruben and Sanchez Rosario
Bought by
Franco Susie
Current Estimated Value
Home Financials for this Owner
Home Financials are based on the most recent Mortgage that was taken out on this home.
Original Mortgage
$209,407
Outstanding Balance
$139,182
Interest Rate
6.59%
Mortgage Type
VA
Estimated Equity
$431,494
Purchase Details
Closed on
Jan 5, 1994
Sold by
Keycorp Mtg Inc
Bought by
Sanchez Ruben and Sanchez Rosario
Home Financials for this Owner
Home Financials are based on the most recent Mortgage that was taken out on this home.
Original Mortgage
$100,150
Interest Rate
7.21%
Mortgage Type
FHA
Create a Home Valuation Report for This Property
The Home Valuation Report is an in-depth analysis detailing your home's value as well as a comparison with similar homes in the area
Home Values in the Area
Average Home Value in this Area
Purchase History
| Date | Buyer | Sale Price | Title Company |
|---|---|---|---|
| Franco Susie | $205,000 | Fidelity Natl | |
| Sanchez Ruben | $100,000 | Chicago Title Co |
Source: Public Records
Mortgage History
| Date | Status | Borrower | Loan Amount |
|---|---|---|---|
| Open | Franco Susie | $209,407 | |
| Previous Owner | Sanchez Ruben | $100,150 |
Source: Public Records
Tax History
| Year | Tax Paid | Tax Assessment Tax Assessment Total Assessment is a certain percentage of the fair market value that is determined by local assessors to be the total taxable value of land and additions on the property. | Land | Improvement |
|---|---|---|---|---|
| 2025 | $3,631 | $263,990 | $77,264 | $186,726 |
| 2024 | $3,493 | $258,814 | $75,749 | $183,065 |
| 2023 | $3,698 | $253,739 | $74,264 | $179,475 |
| 2022 | $3,423 | $248,764 | $72,808 | $175,956 |
| 2021 | $3,402 | $243,886 | $71,380 | $172,506 |
| 2020 | $3,411 | $241,385 | $70,648 | $170,737 |
| 2019 | $3,339 | $236,652 | $69,263 | $167,389 |
| 2018 | $3,229 | $232,012 | $67,905 | $164,107 |
| 2017 | $3,205 | $227,463 | $66,574 | $160,889 |
| 2016 | $2,833 | $223,003 | $65,269 | $157,734 |
| 2015 | $2,843 | $219,654 | $64,289 | $155,365 |
| 2014 | $2,672 | $215,352 | $63,030 | $152,322 |
Source: Public Records
Map
Nearby Homes
- 1015 N Joyce Ave
- 383 E Mesa Dr
- 0 N Acacia Ave Unit CV25094258
- 866 N Eucalyptus Ave
- 979 N Gardena Ave
- 332 E Rosewood St
- 538 N Oakdale Ave
- 1431 N Eucalyptus Ave
- 807 E Etiwanda Ave
- 1149 N Birch Ave
- 1365 N Chestnut Ave
- 508 N Joyce Ave
- 160 W Cascade Dr
- 451 N Oakdale Ave
- 822 E Virginia St
- 836 N Millard Ave
- 470 W Jackson St
- 833 N Lilac Ave
- 2848 7th St
- 1788 N Acacia Ave
- 324 E Shamrock St
- 371 E Jackson St
- 359 E Jackson St
- 1046 N Sage Ave
- 383 E Jackson St
- 345 E Jackson St
- 348 E Shamrock St
- 316 E Shamrock St
- 1045 N Oakdale Ave
- 395 E Jackson St
- 1045 N Sage Ave
- 1036 N Sage Ave
- 308 E Shamrock St
- 400 E Shamrock St
- 1035 N Oakdale Ave
- 1048 N Oakdale Ave
- 411 E Jackson St
- 1116 N Oakdale Ave
- 370 E Jackson St
- 1105 N Sycamore Ave
Your Personal Tour Guide
Ask me questions while you tour the home.