332 Logan St Lemont, IL 60439
Southeast Lemont NeighborhoodEstimated Value: $459,000 - $559,000
3
Beds
3
Baths
1,904
Sq Ft
$272/Sq Ft
Est. Value
About This Home
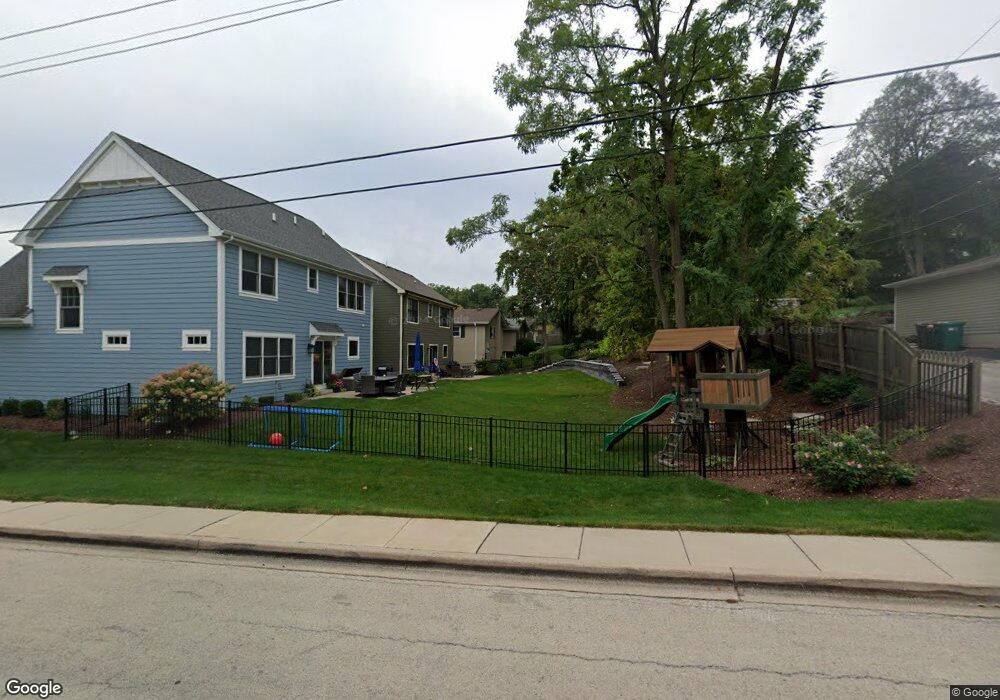
This home is located at 332 Logan St, Lemont, IL 60439 and is currently estimated at $516,955, approximately $271 per square foot. 332 Logan St is a home located in Cook County with nearby schools including Oakwood School, River Valley School, and Old Quarry Middle School.
Ownership History
Date
Name
Owned For
Owner Type
Purchase Details
Closed on
Aug 30, 2018
Sold by
Morgan Homes Llc
Bought by
Paez Matthew and Paez Anne
Current Estimated Value
Home Financials for this Owner
Home Financials are based on the most recent Mortgage that was taken out on this home.
Original Mortgage
$314,800
Outstanding Balance
$274,667
Interest Rate
4.62%
Mortgage Type
New Conventional
Estimated Equity
$242,288
Purchase Details
Closed on
Mar 16, 2018
Sold by
Evancic Tyler and Evancic Morgan
Bought by
Morgan Homes Llc
Purchase Details
Closed on
Feb 13, 2018
Sold by
Morgan Homes Llc
Bought by
Evancic Tyler and Evancic Morgan
Purchase Details
Closed on
Jul 13, 2017
Sold by
Hurth Patrica and Alberti Karen
Bought by
Morgan Homes Llc
Purchase Details
Closed on
Jul 12, 2017
Sold by
Mescher Dorothy Mae and Sliwinski Joseph
Bought by
Morgan Homes Llc
Create a Home Valuation Report for This Property
The Home Valuation Report is an in-depth analysis detailing your home's value as well as a comparison with similar homes in the area
Home Values in the Area
Average Home Value in this Area
Purchase History
| Date | Buyer | Sale Price | Title Company |
|---|---|---|---|
| Paez Matthew | $404,500 | Barrister Title | |
| Morgan Homes Llc | -- | None Available | |
| Evancic Tyler | $65,000 | None Available | |
| Morgan Homes Llc | -- | Greater Illinois Title | |
| Morgan Homes Llc | $85,000 | Greater Illinois Title |
Source: Public Records
Mortgage History
| Date | Status | Borrower | Loan Amount |
|---|---|---|---|
| Open | Paez Matthew | $314,800 |
Source: Public Records
Tax History Compared to Growth
Tax History
| Year | Tax Paid | Tax Assessment Tax Assessment Total Assessment is a certain percentage of the fair market value that is determined by local assessors to be the total taxable value of land and additions on the property. | Land | Improvement |
|---|---|---|---|---|
| 2024 | $8,302 | $43,263 | $4,631 | $38,632 |
| 2023 | $8,322 | $47,000 | $4,631 | $42,369 |
| 2022 | $8,322 | $37,699 | $4,076 | $33,623 |
| 2021 | $8,088 | $37,697 | $4,075 | $33,622 |
| 2020 | $8,227 | $37,697 | $4,075 | $33,622 |
| 2019 | $8,218 | $38,961 | $4,075 | $34,886 |
| 2018 | $927 | $4,075 | $4,075 | $0 |
| 2017 | $2,925 | $13,051 | $4,075 | $8,976 |
| 2016 | $1,463 | $10,477 | $3,334 | $7,143 |
| 2015 | $2,511 | $10,477 | $3,334 | $7,143 |
| 2014 | $1,026 | $10,477 | $3,334 | $7,143 |
| 2013 | $1,039 | $12,002 | $3,334 | $8,668 |
Source: Public Records
Map
Nearby Homes