332 Main St Battle Creek, MI 49014
Post Franklin NeighborhoodEstimated Value: $16,000 - $172,000
3
Beds
2
Baths
1,082
Sq Ft
$89/Sq Ft
Est. Value
About This Home
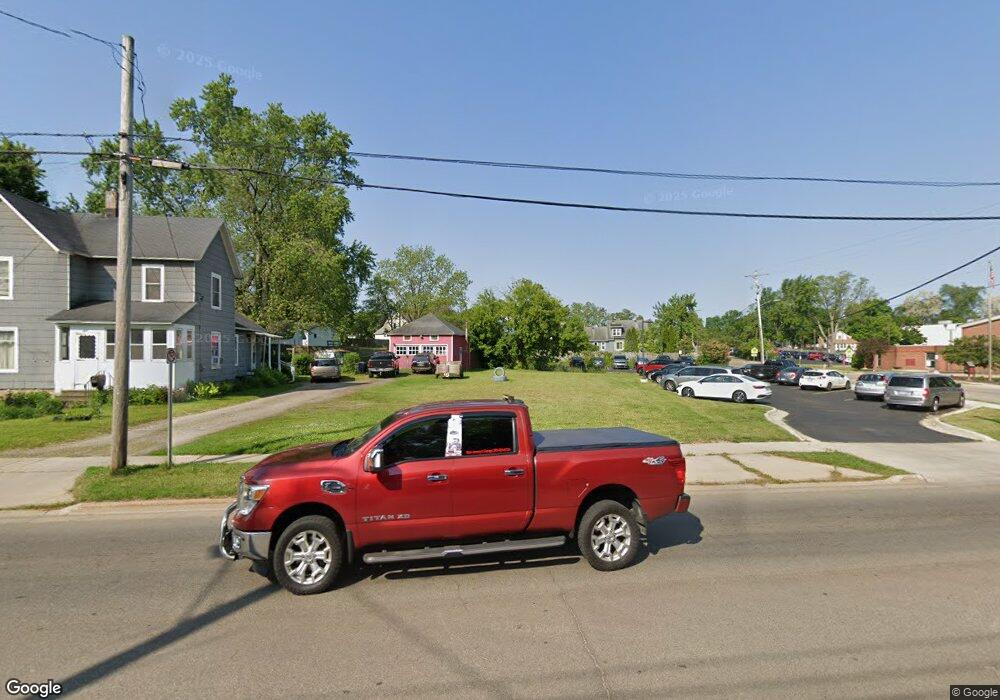
This home is located at 332 Main St, Battle Creek, MI 49014 and is currently estimated at $96,667, approximately $89 per square foot. 332 Main St is a home located in Calhoun County with nearby schools including Post-Franklin Elementary School, Springfield Middle School, and Battle Creek Central High School.
Ownership History
Date
Name
Owned For
Owner Type
Purchase Details
Closed on
Dec 20, 2016
Sold by
Calhoun County Land Bank Authority
Bought by
Hernandez Rafael Paula and Hernandez Grace
Current Estimated Value
Purchase Details
Closed on
Dec 16, 2014
Sold by
Calhoun County Treasurer
Bought by
Calhoun County Land Bank Authority
Purchase Details
Closed on
May 26, 2006
Sold by
Moss Dan
Bought by
Wachovia Bank Na
Purchase Details
Closed on
Mar 23, 2003
Sold by
Moss Dan
Purchase Details
Closed on
Dec 24, 1992
Sold by
Moss Bessie L
Create a Home Valuation Report for This Property
The Home Valuation Report is an in-depth analysis detailing your home's value as well as a comparison with similar homes in the area
Home Values in the Area
Average Home Value in this Area
Purchase History
| Date | Buyer | Sale Price | Title Company |
|---|---|---|---|
| Hernandez Rafael Paula | $200 | None Available | |
| Calhoun County Land Bank Authority | -- | None Available | |
| Wachovia Bank Na | $24,110 | None Available | |
| -- | -- | -- | |
| -- | -- | -- |
Source: Public Records
Tax History Compared to Growth
Tax History
| Year | Tax Paid | Tax Assessment Tax Assessment Total Assessment is a certain percentage of the fair market value that is determined by local assessors to be the total taxable value of land and additions on the property. | Land | Improvement |
|---|---|---|---|---|
| 2025 | -- | $2,600 | $0 | $0 |
| 2024 | $18 | $1,963 | $0 | $0 |
| 2023 | $20 | $1,309 | $0 | $0 |
| 2022 | $16 | $916 | $0 | $0 |
| 2021 | $19 | $785 | $0 | $0 |
| 2020 | $18 | $654 | $0 | $0 |
| 2019 | $18 | $524 | $0 | $0 |
| 2018 | $18 | $524 | $524 | $0 |
| 2017 | -- | $383 | $0 | $0 |
| 2016 | -- | $2,620 | $0 | $0 |
| 2015 | $835 | $2,620 | $2,620 | $0 |
| 2014 | $835 | $12,992 | $2,620 | $10,372 |
Source: Public Records
Map
Nearby Homes