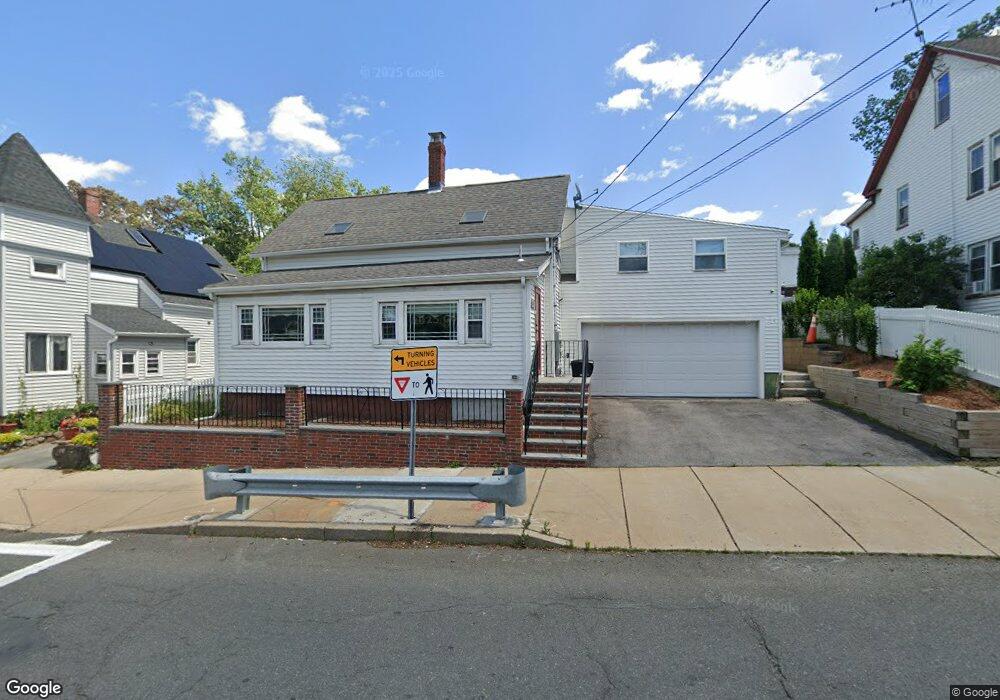
332 Maple St Lynn, MA 01904
Agganis AC NeighborhoodEstimated Value: $579,000 - $695,278
3
Beds
2
Baths
1,819
Sq Ft
$360/Sq Ft
Est. Value
About This Home
This home is located at 332 Maple St, Lynn, MA 01904 and is currently estimated at $654,570, approximately $359 per square foot. 332 Maple St is a home located in Essex County with nearby schools including Edward A. Sisson Elementary School, William R. Fallon School, and Fecteau-Leary Junior/Senior High School.
Ownership History
Date
Name
Owned For
Owner Type
Purchase Details
Closed on
Feb 20, 1998
Sold by
Tarbox Gilbert W and Tarbox Linda W
Bought by
Tran Mysang and Ring Hiep
Current Estimated Value
Create a Home Valuation Report for This Property
The Home Valuation Report is an in-depth analysis detailing your home's value as well as a comparison with similar homes in the area
Home Values in the Area
Average Home Value in this Area
Purchase History
| Date | Buyer | Sale Price | Title Company |
|---|---|---|---|
| Tran Mysang | $95,000 | -- | |
| Tran Mysang | $95,000 | -- |
Source: Public Records
Mortgage History
| Date | Status | Borrower | Loan Amount |
|---|---|---|---|
| Open | Tran Mysang | $277,000 | |
| Closed | Tran Mysang | $50,000 | |
| Closed | Tran Mysang | $210,000 |
Source: Public Records
Tax History
| Year | Tax Paid | Tax Assessment Tax Assessment Total Assessment is a certain percentage of the fair market value that is determined by local assessors to be the total taxable value of land and additions on the property. | Land | Improvement |
|---|---|---|---|---|
| 2025 | $6,544 | $631,700 | $203,500 | $428,200 |
| 2024 | $6,351 | $603,100 | $198,900 | $404,200 |
| 2023 | $5,642 | $506,000 | $187,000 | $319,000 |
| 2022 | $5,361 | $431,300 | $147,000 | $284,300 |
| 2021 | $5,392 | $413,800 | $148,800 | $265,000 |
| 2020 | $5,063 | $377,800 | $134,100 | $243,700 |
| 2019 | $5,082 | $355,400 | $126,300 | $229,100 |
| 2018 | $4,674 | $308,500 | $117,600 | $190,900 |
| 2017 | $4,253 | $272,600 | $103,800 | $168,800 |
| 2016 | $4,128 | $255,100 | $96,000 | $159,100 |
| 2015 | $4,025 | $240,300 | $102,000 | $138,300 |
Source: Public Records
Map
Nearby Homes
- 325 Western Ave
- 70 Grant St
- 200 Locust St Unit 706
- 15 Nichols Ave
- 10 Pond St
- 198 Locust St Unit 303
- 2 Chestnut Terrace
- 1 Clough St
- 199 Allen Ave
- 6-8 Beede Ave
- 102 Henry Ave
- 67 Beacon Hill Ave
- 49 Eade St
- 69 Hollingsworth St Unit 69A
- 105 Lawton Ave
- 51 Laighton St Unit 7
- 27-29 Graves Ave
- 102 Rockaway St
- 31 Jefferson St
- 19 Gage St
Your Personal Tour Guide
Ask me questions while you tour the home.