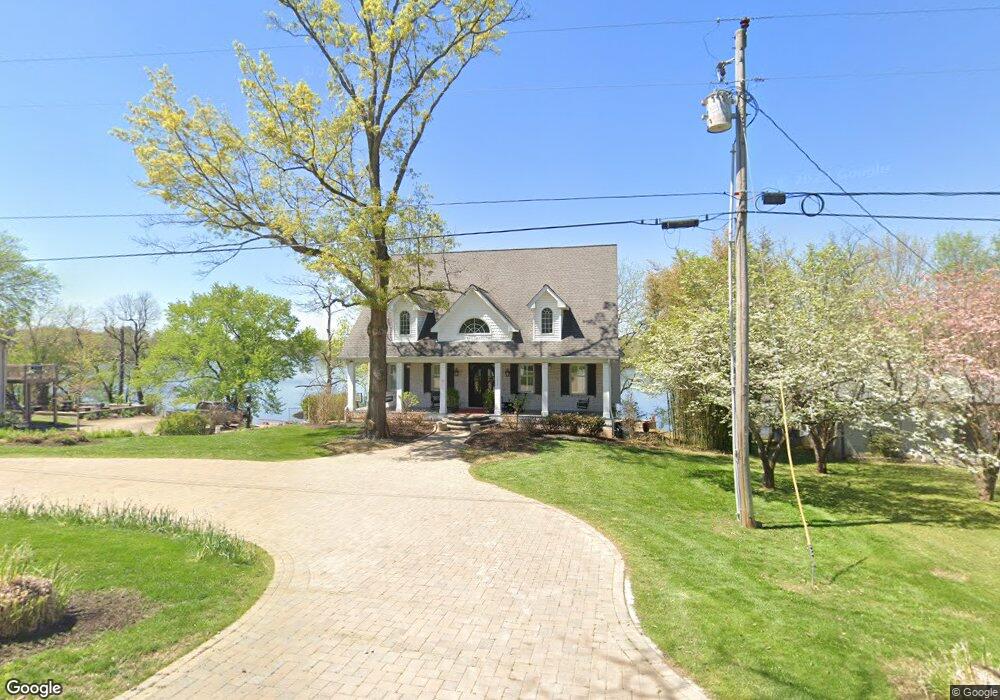
332 N Denny Rd Lebanon, TN 37087
Estimated Value: $809,122 - $1,210,000
--
Bed
3
Baths
4,628
Sq Ft
$223/Sq Ft
Est. Value
About This Home
This home is located at 332 N Denny Rd, Lebanon, TN 37087 and is currently estimated at $1,032,781, approximately $223 per square foot. 332 N Denny Rd is a home located in Wilson County with nearby schools including Carroll Oakland Elementary School, Lebanon High School, and Friendship Christian School.
Ownership History
Date
Name
Owned For
Owner Type
Purchase Details
Closed on
Oct 20, 2020
Sold by
Wittrig Ricky Dean and Wittrig Ladonna Kay
Bought by
Wittrig Ladonna Kay and Wittrig Ricky Dean
Current Estimated Value
Purchase Details
Closed on
Jun 4, 2004
Sold by
Gary Mccray
Bought by
Dean Wittrig Ricky
Home Financials for this Owner
Home Financials are based on the most recent Mortgage that was taken out on this home.
Original Mortgage
$245,000
Interest Rate
5.35%
Purchase Details
Closed on
Apr 29, 2004
Sold by
Gary Mccray
Bought by
Dean Wittrig Ricky
Home Financials for this Owner
Home Financials are based on the most recent Mortgage that was taken out on this home.
Original Mortgage
$245,000
Interest Rate
5.35%
Purchase Details
Closed on
May 7, 1999
Sold by
Etal Chamberlain Gay M
Bought by
Gary Mccray
Purchase Details
Closed on
Aug 13, 1991
Bought by
Chamberlain Gay M
Purchase Details
Closed on
Apr 4, 1904
Bought by
Mcfarland Gwendolyn
Create a Home Valuation Report for This Property
The Home Valuation Report is an in-depth analysis detailing your home's value as well as a comparison with similar homes in the area
Home Values in the Area
Average Home Value in this Area
Purchase History
| Date | Buyer | Sale Price | Title Company |
|---|---|---|---|
| Wittrig Ladonna Kay | -- | None Available | |
| Dean Wittrig Ricky | -- | -- | |
| Dean Wittrig Ricky | $433,000 | -- | |
| Gary Mccray | $67,500 | -- | |
| Chamberlain Gay M | $56,700 | -- | |
| Mcfarland Gwendolyn | -- | -- |
Source: Public Records
Mortgage History
| Date | Status | Borrower | Loan Amount |
|---|---|---|---|
| Closed | Mcfarland Gwendolyn | $245,000 |
Source: Public Records
Tax History Compared to Growth
Tax History
| Year | Tax Paid | Tax Assessment Tax Assessment Total Assessment is a certain percentage of the fair market value that is determined by local assessors to be the total taxable value of land and additions on the property. | Land | Improvement |
|---|---|---|---|---|
| 2024 | $2,568 | $134,550 | $46,250 | $88,300 |
| 2022 | $2,568 | $134,550 | $46,250 | $88,300 |
| 2021 | $2,568 | $134,550 | $46,250 | $88,300 |
| 2020 | $4,050 | $134,550 | $46,250 | $88,300 |
| 2019 | $4,050 | $160,800 | $49,500 | $111,300 |
| 2018 | $4,050 | $160,800 | $49,500 | $111,300 |
| 2017 | $4,050 | $160,800 | $49,500 | $111,300 |
| 2016 | $4,050 | $160,800 | $49,500 | $111,300 |
| 2015 | $4,133 | $160,800 | $49,500 | $111,300 |
| 2014 | $2,937 | $114,281 | $0 | $0 |
Source: Public Records
Map
Nearby Homes
- 409 Stone Brook Way
- 304 Stonebrook Point
- 302 Stonebrook Point
- 815 Stonebrook Dr
- 813 Stonebrook Dr
- 203 Brookside Cove
- 1780 Berea Church Rd
- 272 Davis Rd
- 1556A Berea Church Rd
- 172 Watermill Ln Lot 33
- 192 Watermill Ln
- 144 Watermill Ln
- 400 Millstone Place
- 1812 Pointe Ct
- 1352 Berea Church Rd
- 1805 Pointe Ct
- 319 Goodwin Ln
- 321 Goodwin Ln
- 317 Goodwin Ln
- 1113 E Robertson Rd