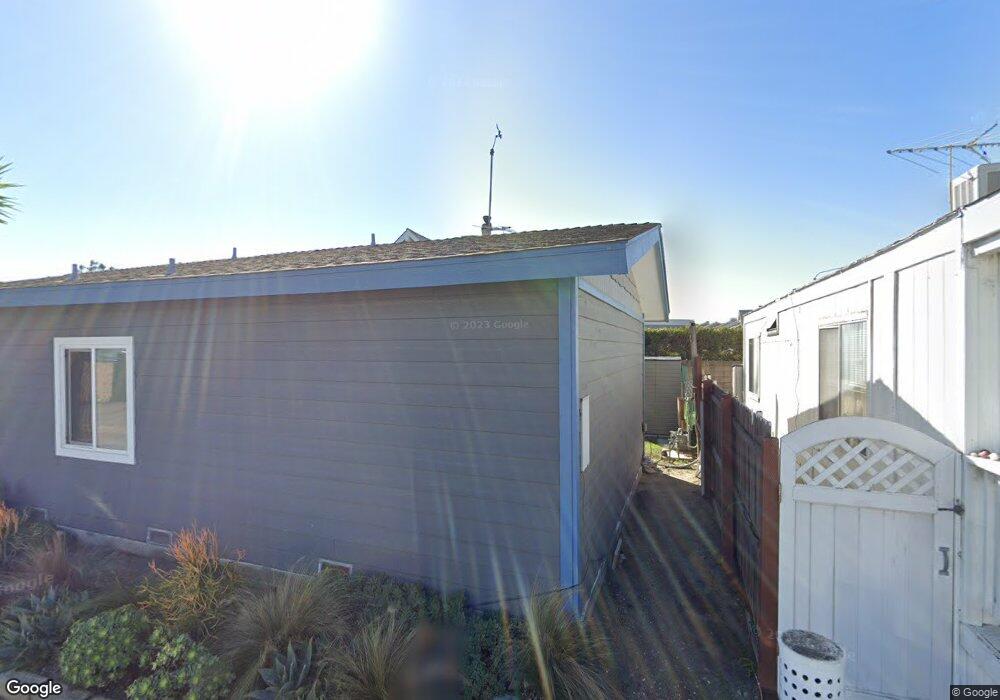
332 Regatta Way Seal Beach, CA 90740
Estimated Value: $1,382,000 - $1,776,000
3
Beds
3
Baths
1,757
Sq Ft
$892/Sq Ft
Est. Value
About This Home
This home is located at 332 Regatta Way, Seal Beach, CA 90740 and is currently estimated at $1,566,440, approximately $891 per square foot. 332 Regatta Way is a home located in Orange County with nearby schools including J. H. Mcgaugh Elementary School, Jack L. Weaver Elementary School, and Sharon Christa Mcauliffe Middle School.
Ownership History
Date
Name
Owned For
Owner Type
Purchase Details
Closed on
Dec 28, 2016
Sold by
Stewart William G
Bought by
Stewart William G and William G Stewart Trust
Current Estimated Value
Purchase Details
Closed on
Aug 20, 1998
Sold by
Sample Dan D and Sample Virginia L
Bought by
Stewart William G
Home Financials for this Owner
Home Financials are based on the most recent Mortgage that was taken out on this home.
Original Mortgage
$268,000
Outstanding Balance
$55,715
Interest Rate
6.88%
Estimated Equity
$1,510,725
Purchase Details
Closed on
Feb 2, 1995
Sold by
Vanatta Lois
Bought by
Sample Dan D and Virginia Sample L
Home Financials for this Owner
Home Financials are based on the most recent Mortgage that was taken out on this home.
Original Mortgage
$283,500
Interest Rate
9.09%
Create a Home Valuation Report for This Property
The Home Valuation Report is an in-depth analysis detailing your home's value as well as a comparison with similar homes in the area
Home Values in the Area
Average Home Value in this Area
Purchase History
| Date | Buyer | Sale Price | Title Company |
|---|---|---|---|
| Stewart William G | -- | None Available | |
| Stewart William G | $335,000 | North American Title Co | |
| Sample Dan D | $315,000 | Continental Lawyers Title Co | |
| Vanatta Lois | $320,000 | Continental Lawyers Title Co |
Source: Public Records
Mortgage History
| Date | Status | Borrower | Loan Amount |
|---|---|---|---|
| Open | Stewart William G | $268,000 | |
| Previous Owner | Sample Dan D | $283,500 |
Source: Public Records
Tax History Compared to Growth
Tax History
| Year | Tax Paid | Tax Assessment Tax Assessment Total Assessment is a certain percentage of the fair market value that is determined by local assessors to be the total taxable value of land and additions on the property. | Land | Improvement |
|---|---|---|---|---|
| 2025 | $6,273 | $525,175 | $316,605 | $208,570 |
| 2024 | $6,273 | $514,878 | $310,397 | $204,481 |
| 2023 | $6,127 | $504,783 | $304,311 | $200,472 |
| 2022 | $6,055 | $494,886 | $298,344 | $196,542 |
| 2021 | $5,917 | $485,183 | $292,494 | $192,689 |
| 2020 | $5,919 | $480,209 | $289,495 | $190,714 |
| 2019 | $5,739 | $470,794 | $283,819 | $186,975 |
| 2018 | $5,481 | $461,563 | $278,254 | $183,309 |
| 2017 | $5,363 | $452,513 | $272,798 | $179,715 |
| 2016 | $5,259 | $443,641 | $267,449 | $176,192 |
| 2015 | $5,189 | $436,978 | $263,432 | $173,546 |
| 2014 | $5,061 | $428,419 | $258,272 | $170,147 |
Source: Public Records
Map
Nearby Homes
- 330 Regatta Way
- 334 Regatta Way
- 328 Regatta Way
- 336 Regatta Way
- 338 Regatta Way
- 324 Regatta Way
- 333 Spinnaker Way
- 335 Spinnaker Way
- 331 Spinnaker Way
- 335 Regatta Way
- 333 Regatta Way
- 337 Spinnaker Way
- 337 Regatta Way
- 331 Regatta Way
- 329 Spinnaker Way
- 339 Regatta Way
- 329 Regatta Way
- 327 Spinnaker Way
- 1 Cottonwood Ln Unit 1
- 341 Regatta Way