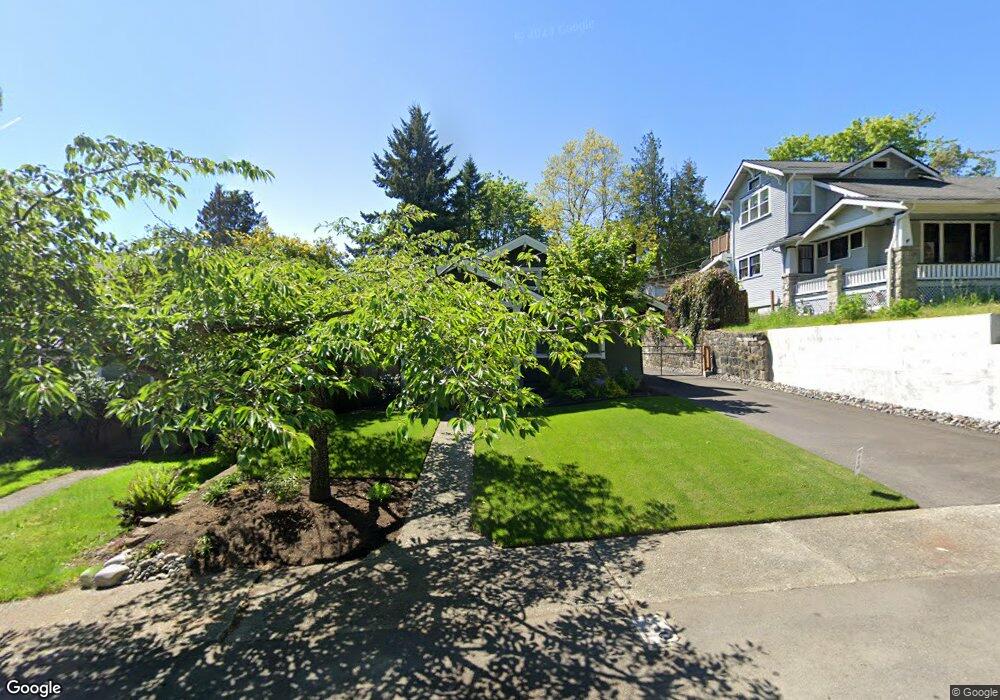
3320 S 9th St Tacoma, WA 98405
Central Tacoma NeighborhoodEstimated Value: $438,000 - $530,000
4
Beds
1
Bath
2,353
Sq Ft
$212/Sq Ft
Est. Value
About This Home
This home is located at 3320 S 9th St, Tacoma, WA 98405 and is currently estimated at $497,867, approximately $211 per square foot. 3320 S 9th St is a home located in Pierce County with nearby schools including Franklin Elementary School, Mason Middle School, and Foss High School.
Ownership History
Date
Name
Owned For
Owner Type
Purchase Details
Closed on
Jun 25, 2021
Sold by
Palmer Travis and Palmer Carra
Bought by
Palmer Travis and Palmer Carra
Current Estimated Value
Home Financials for this Owner
Home Financials are based on the most recent Mortgage that was taken out on this home.
Original Mortgage
$325,000
Outstanding Balance
$248,388
Interest Rate
2.9%
Mortgage Type
New Conventional
Estimated Equity
$249,479
Purchase Details
Closed on
May 18, 2004
Sold by
Stone Properties Iv Llc
Bought by
Palmer Travis
Home Financials for this Owner
Home Financials are based on the most recent Mortgage that was taken out on this home.
Original Mortgage
$126,400
Interest Rate
6.5%
Mortgage Type
Purchase Money Mortgage
Purchase Details
Closed on
Nov 1, 2002
Sold by
Bracken Stuart J
Bought by
Stone Properties Iv
Purchase Details
Closed on
Sep 29, 2000
Sold by
Bracken Stuart J
Bought by
Stone Properties Iv Ltd Liability Corp
Purchase Details
Closed on
Jun 1, 1999
Sold by
Hyppa Sandra J
Bought by
Bracken Stuart and Milan Bracken Athena
Create a Home Valuation Report for This Property
The Home Valuation Report is an in-depth analysis detailing your home's value as well as a comparison with similar homes in the area
Home Values in the Area
Average Home Value in this Area
Purchase History
| Date | Buyer | Sale Price | Title Company |
|---|---|---|---|
| Palmer Travis | -- | Accommodation | |
| Palmer Travis | $158,000 | Lawyers Title | |
| Stone Properties Iv | -- | -- | |
| Stone Properties Iv Ltd Liability Corp | -- | -- | |
| Bracken Stuart | $103,542 | -- |
Source: Public Records
Mortgage History
| Date | Status | Borrower | Loan Amount |
|---|---|---|---|
| Open | Palmer Travis | $325,000 | |
| Closed | Palmer Travis | $126,400 | |
| Closed | Palmer Travis | $31,600 |
Source: Public Records
Tax History Compared to Growth
Tax History
| Year | Tax Paid | Tax Assessment Tax Assessment Total Assessment is a certain percentage of the fair market value that is determined by local assessors to be the total taxable value of land and additions on the property. | Land | Improvement |
|---|---|---|---|---|
| 2025 | $4,789 | $466,800 | $239,300 | $227,500 |
| 2024 | $4,789 | $459,100 | $232,400 | $226,700 |
| 2023 | $4,789 | $430,100 | $216,800 | $213,300 |
| 2022 | $4,543 | $466,800 | $226,200 | $240,600 |
| 2021 | $4,198 | $333,900 | $133,200 | $200,700 |
| 2019 | $3,467 | $306,000 | $106,700 | $199,300 |
| 2018 | $3,467 | $266,700 | $89,600 | $177,100 |
| 2017 | $3,160 | $219,400 | $72,800 | $146,600 |
| 2016 | $2,764 | $168,800 | $55,300 | $113,500 |
| 2014 | $2,462 | $158,900 | $49,500 | $109,400 |
| 2013 | $2,462 | $146,700 | $43,700 | $103,000 |
Source: Public Records
Map
Nearby Homes
- 716 S Puget Sound Ave
- 3417 S 12th St
- 3310 6th Ave Unit A-C
- 3517 S 11th St
- 3501 6th Ave
- 3606 S 12th St
- 1002 S Washington St
- 819 S Adams St
- 616 N Junett St
- 1231 S Washington St
- 3816 S 11th St
- 3820 S 12th St
- 3824 S 12th St
- 621 N Pine St
- 858 S Fife St Unit 1
- 1404 S Adams St
- 1301 S Durango St
- 1246 S Durango St
- 1207 S Fife St
- 3822 N 8th St
- 3318 S 9th St
- 3324 S 9th St
- 3306 S 9th St
- 3313 S 10th St
- 3402 S 9th St
- 3310 S 9th St
- 3323 S 9th St
- 3311 S 10th St
- 3317 S 9th St
- 3313 S 9th St
- 912 S Lawrence St
- 906 S Lawrence St
- 3309 S 9th St
- 809 S Warner St
- 916 S Lawrence St
- 3401 S 10th St
- 3408 S 9th St
- 820 S Lawrence St
- 820 S Warner St
- 920 S Lawrence St