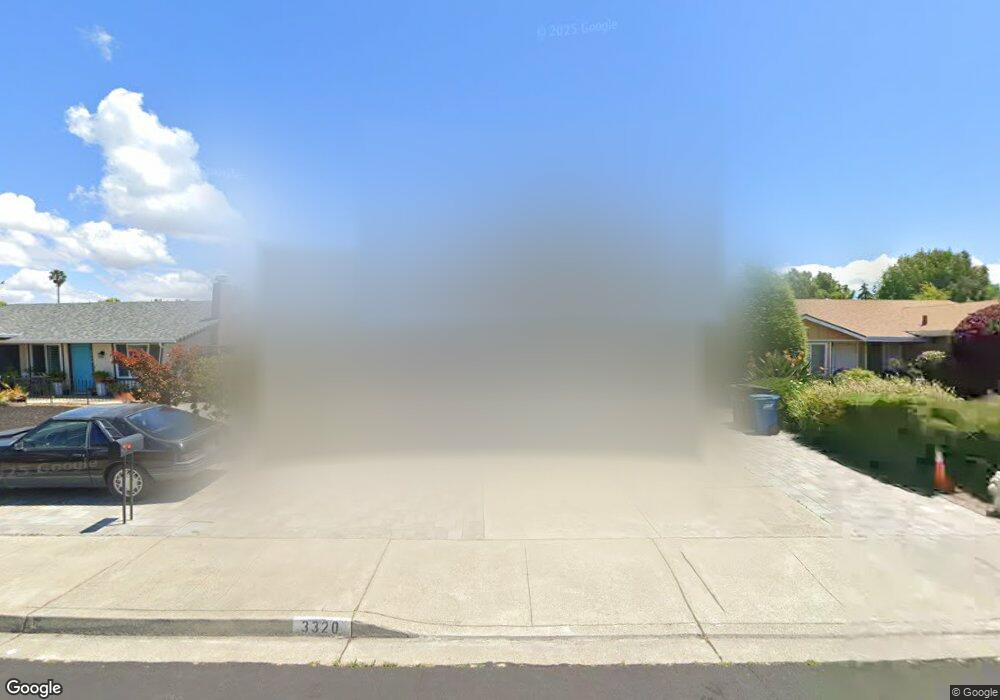
3320 San Luces Way Union City, CA 94587
Alvarado NeighborhoodEstimated Value: $1,019,000 - $1,462,233
4
Beds
3
Baths
1,887
Sq Ft
$699/Sq Ft
Est. Value
About This Home
This home is located at 3320 San Luces Way, Union City, CA 94587 and is currently estimated at $1,319,308, approximately $699 per square foot. 3320 San Luces Way is a home located in Alameda County with nearby schools including Alvarado Elementary School, Itliong-Vera Cruz, and James Logan High School.
Ownership History
Date
Name
Owned For
Owner Type
Purchase Details
Closed on
Nov 5, 2020
Sold by
Singh Ashok A and Singh Baljit
Bought by
Singh Ashok A and Singh Baljit
Current Estimated Value
Home Financials for this Owner
Home Financials are based on the most recent Mortgage that was taken out on this home.
Original Mortgage
$563,250
Outstanding Balance
$500,304
Interest Rate
2.7%
Mortgage Type
New Conventional
Estimated Equity
$819,004
Purchase Details
Closed on
Apr 24, 2017
Sold by
Kaur Palwinder
Bought by
Singh Baljit
Home Financials for this Owner
Home Financials are based on the most recent Mortgage that was taken out on this home.
Original Mortgage
$600,800
Interest Rate
4.3%
Mortgage Type
New Conventional
Purchase Details
Closed on
Apr 20, 2017
Sold by
Armijo Deborah A
Bought by
Singh Ashok A and Singh Baljit
Home Financials for this Owner
Home Financials are based on the most recent Mortgage that was taken out on this home.
Original Mortgage
$600,800
Interest Rate
4.3%
Mortgage Type
New Conventional
Create a Home Valuation Report for This Property
The Home Valuation Report is an in-depth analysis detailing your home's value as well as a comparison with similar homes in the area
Home Values in the Area
Average Home Value in this Area
Purchase History
| Date | Buyer | Sale Price | Title Company |
|---|---|---|---|
| Singh Ashok A | -- | None Available | |
| Singh Baljit | -- | Fidelity National Title Co | |
| Singh Ashok A | $751,000 | Fidelity National Title Co |
Source: Public Records
Mortgage History
| Date | Status | Borrower | Loan Amount |
|---|---|---|---|
| Open | Singh Ashok A | $563,250 | |
| Closed | Singh Ashok A | $600,800 |
Source: Public Records
Tax History Compared to Growth
Tax History
| Year | Tax Paid | Tax Assessment Tax Assessment Total Assessment is a certain percentage of the fair market value that is determined by local assessors to be the total taxable value of land and additions on the property. | Land | Improvement |
|---|---|---|---|---|
| 2025 | $12,967 | $871,580 | $261,474 | $610,106 |
| 2024 | $12,967 | $854,494 | $256,348 | $598,146 |
| 2023 | $11,811 | $837,740 | $251,322 | $586,418 |
| 2022 | $11,618 | $821,315 | $246,394 | $574,921 |
| 2021 | $11,361 | $805,214 | $241,564 | $563,650 |
| 2020 | $11,118 | $796,960 | $239,088 | $557,872 |
| 2019 | $11,233 | $781,340 | $234,402 | $546,938 |
| 2018 | $10,978 | $766,020 | $229,806 | $536,214 |
| 2017 | $3,314 | $165,891 | $64,405 | $101,486 |
| 2016 | $3,196 | $162,638 | $63,142 | $99,496 |
| 2015 | $3,127 | $160,196 | $62,194 | $98,002 |
| 2014 | $3,008 | $157,059 | $60,976 | $96,083 |
Source: Public Records
Map
Nearby Homes
- 3305 San Carlos Way
- 30996 Granger Ave
- 30784 Tidewater Dr
- 30651 Carr Way
- 4167 Sunflower Ct
- 3178 Santa Marta Ct
- 3142 Sugar Beet Way
- 4263 Queen Anne Dr
- 4100 Aquarius Cir
- 3058 Flint St Unit 40
- 2955 Risdon Dr Unit 88
- 30921 Union City Blvd Unit 30927
- 4214 Saturn Way
- 2572 Parkside Dr
- 4201 Saturn Way
- 32542 Lake Tana St
- 2469 Ascot Way
- 2544 Franklin Ave Unit 172
- 4633 Granada Way
- 4506 Birchwood Ct
- 3324 San Luces Way
- 3316 San Luces Way
- 3321 San Pedro Ct
- 3328 San Luces Way
- 3312 San Luces Way
- 3317 San Pedro Ct
- 3325 San Pedro Ct
- 3313 San Pedro Ct
- 3332 San Luces Way
- 3319 San Luces Way
- 3308 San Luces Way
- 3315 San Luces Way
- 3323 San Luces Way
- 3323 San Luces Way
- 3327 San Luces Way
- 3309 San Pedro Ct
- 3311 San Luces Way
- 3329 San Pedro Ct
- 3414 San Pedro Ct
- 3304 San Luces Way