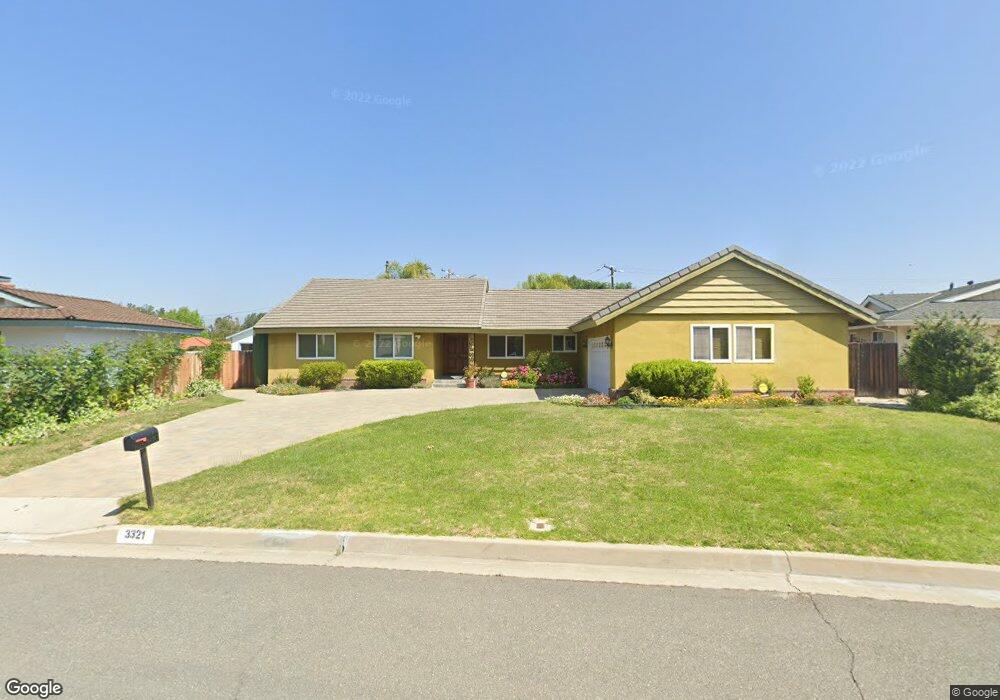
3321 E Jodee Dr West Covina, CA 91791
South Hills NeighborhoodEstimated Value: $852,000 - $1,394,000
4
Beds
3
Baths
1,816
Sq Ft
$599/Sq Ft
Est. Value
About This Home
This home is located at 3321 E Jodee Dr, West Covina, CA 91791 and is currently estimated at $1,088,515, approximately $599 per square foot. 3321 E Jodee Dr is a home located in Los Angeles County with nearby schools including Mesa Elementary School, South Hills High School, and Christ Lutheran School.
Ownership History
Date
Name
Owned For
Owner Type
Purchase Details
Closed on
Aug 2, 2004
Sold by
Chu Isaac and Chu Debby
Bought by
Chu Isaac and Shih Debby
Current Estimated Value
Purchase Details
Closed on
Jan 6, 2004
Sold by
Chu Isaac and Shih Debby
Bought by
Chu Isaac and Chu Debby
Home Financials for this Owner
Home Financials are based on the most recent Mortgage that was taken out on this home.
Original Mortgage
$240,000
Outstanding Balance
$112,083
Interest Rate
5.88%
Mortgage Type
New Conventional
Estimated Equity
$976,432
Purchase Details
Closed on
Oct 12, 1998
Sold by
Alvidrez Jorge A
Bought by
Chu Isaac and Shin Debby
Home Financials for this Owner
Home Financials are based on the most recent Mortgage that was taken out on this home.
Original Mortgage
$200,000
Interest Rate
6.78%
Purchase Details
Closed on
Feb 10, 1994
Sold by
Reveles Daniel
Bought by
Alvidrez Jorge A
Home Financials for this Owner
Home Financials are based on the most recent Mortgage that was taken out on this home.
Original Mortgage
$292,500
Interest Rate
7.24%
Create a Home Valuation Report for This Property
The Home Valuation Report is an in-depth analysis detailing your home's value as well as a comparison with similar homes in the area
Home Values in the Area
Average Home Value in this Area
Purchase History
| Date | Buyer | Sale Price | Title Company |
|---|---|---|---|
| Chu Isaac | -- | -- | |
| Chu Isaac | -- | Investors Title Company | |
| Chu Isaac | $280,000 | Equity Title | |
| Alvidrez Jorge A | -- | Southland Title Corporation |
Source: Public Records
Mortgage History
| Date | Status | Borrower | Loan Amount |
|---|---|---|---|
| Open | Chu Isaac | $240,000 | |
| Previous Owner | Chu Isaac | $200,000 | |
| Previous Owner | Alvidrez Jorge A | $292,500 |
Source: Public Records
Tax History
| Year | Tax Paid | Tax Assessment Tax Assessment Total Assessment is a certain percentage of the fair market value that is determined by local assessors to be the total taxable value of land and additions on the property. | Land | Improvement |
|---|---|---|---|---|
| 2025 | $5,608 | $438,934 | $292,054 | $146,880 |
| 2024 | $5,608 | $430,328 | $286,328 | $144,000 |
| 2023 | $5,526 | $421,891 | $280,714 | $141,177 |
| 2022 | $5,451 | $413,619 | $275,210 | $138,409 |
| 2021 | $5,367 | $405,510 | $269,814 | $135,696 |
| 2019 | $5,235 | $393,484 | $261,812 | $131,672 |
| 2018 | $4,916 | $385,770 | $256,679 | $129,091 |
| 2016 | $4,627 | $370,792 | $246,713 | $124,079 |
| 2015 | $4,506 | $365,224 | $243,008 | $122,216 |
| 2014 | $4,449 | $358,070 | $238,248 | $119,822 |
Source: Public Records
Map
Nearby Homes
- 211 S Grand Ave
- 3340 E Springcreek Rd
- 3295 E Springcreek Rd
- 3230 E Drycreek Rd
- 3229 E Drycreek Rd
- 3614 E Holt Ave
- 512 S Barranca St
- 707 S Grand Ave
- 3528 E Miriam Dr
- 130 S Barranca St Unit 302
- 1108 Dawn Ridge Way
- 662 E Workman St
- 130 S Barranca Ave Unit 305
- 1117 Dawn Ridge Way
- 20050 E Lorencita Dr
- 2333 N Coronet Ct
- 1036 E Covina Hills Rd
- 756 Rancho Sinaloa Dr
- 751 S Corrida Dr
- 3195 Hampton Dr
- 3329 E Jodee Dr
- 3313 E Jodee Dr
- 432 S Charvers Ave
- 3326 E Sunset Hill Dr
- 3354 E Sunset Hill Dr
- 520 S Charvers Ave
- 3339 E Jodee Dr
- 3328 E Jodee Dr
- 420 S Charvers Ave
- 3338 E Sunset Hill Dr
- 3338 E Jodee Dr
- 513 S Charvers Ave
- 505 S Charvers Ave
- 528 S Charvers Ave
- 521 S Charvers Ave
- 437 S Charvers Ave
- 525 S Trona Ave
- 3329 E Sunset Hill Dr
- 3401 E Jodee Dr
- 529 S Charvers Ave
Your Personal Tour Guide
Ask me questions while you tour the home.