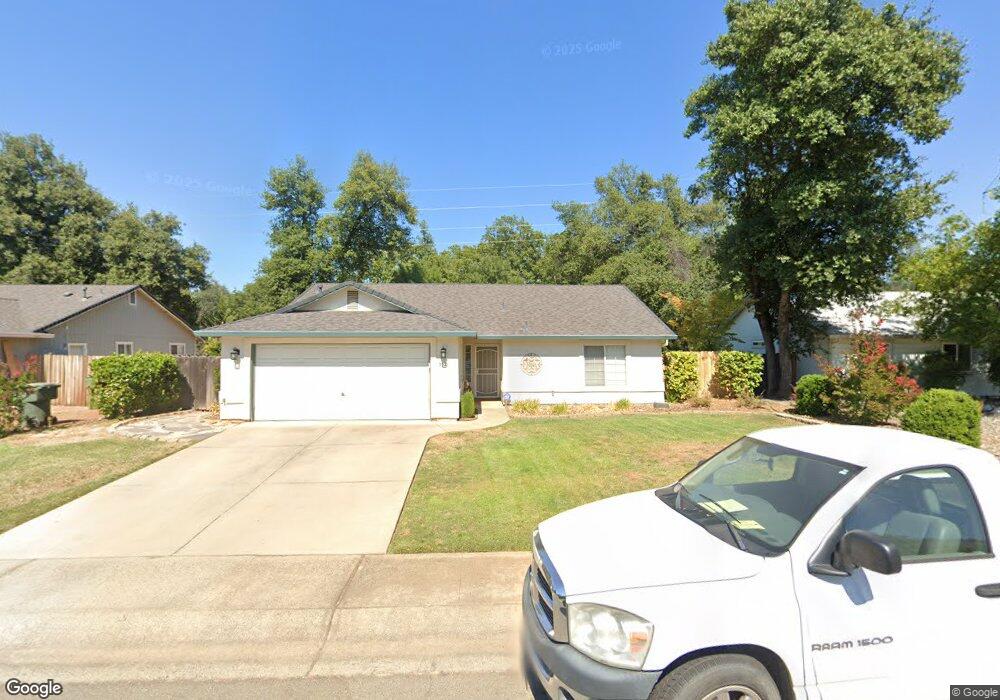
3321 Lawrence Rd Redding, CA 96002
Enterprise NeighborhoodEstimated Value: $327,000 - $382,000
3
Beds
2
Baths
1,417
Sq Ft
$257/Sq Ft
Est. Value
About This Home
This home is located at 3321 Lawrence Rd, Redding, CA 96002 and is currently estimated at $363,711, approximately $256 per square foot. 3321 Lawrence Rd is a home located in Shasta County with nearby schools including Rother Elementary School, Parsons Junior High School, and Enterprise High School.
Ownership History
Date
Name
Owned For
Owner Type
Purchase Details
Closed on
Jun 9, 2023
Sold by
Juede Renee Littldove
Bought by
Jeude Justin M
Current Estimated Value
Home Financials for this Owner
Home Financials are based on the most recent Mortgage that was taken out on this home.
Original Mortgage
$339,500
Outstanding Balance
$330,488
Interest Rate
6.43%
Mortgage Type
New Conventional
Estimated Equity
$33,223
Purchase Details
Closed on
Jul 15, 2011
Sold by
Suter Patrick J
Bought by
Hightower Dewayne D
Home Financials for this Owner
Home Financials are based on the most recent Mortgage that was taken out on this home.
Original Mortgage
$189,000
Interest Rate
4.45%
Mortgage Type
VA
Purchase Details
Closed on
Jan 13, 2009
Sold by
Suter Cynthia L
Bought by
Suter Cynthia L
Purchase Details
Closed on
Nov 5, 1998
Sold by
Shearing Donald A
Bought by
Suter Cynthia L
Home Financials for this Owner
Home Financials are based on the most recent Mortgage that was taken out on this home.
Original Mortgage
$86,250
Interest Rate
6.61%
Create a Home Valuation Report for This Property
The Home Valuation Report is an in-depth analysis detailing your home's value as well as a comparison with similar homes in the area
Home Values in the Area
Average Home Value in this Area
Purchase History
| Date | Buyer | Sale Price | Title Company |
|---|---|---|---|
| Jeude Justin M | -- | First American Title | |
| Jeude Justin M | $350,000 | First American Title | |
| Hightower Dewayne D | $189,000 | Fidelity Natl Title Co Of Ca | |
| Suter Cynthia L | -- | None Available | |
| Suter Cynthia L | $108,500 | First American Title |
Source: Public Records
Mortgage History
| Date | Status | Borrower | Loan Amount |
|---|---|---|---|
| Open | Jeude Justin M | $339,500 | |
| Previous Owner | Hightower Dewayne D | $189,000 | |
| Previous Owner | Suter Cynthia L | $86,250 |
Source: Public Records
Tax History
| Year | Tax Paid | Tax Assessment Tax Assessment Total Assessment is a certain percentage of the fair market value that is determined by local assessors to be the total taxable value of land and additions on the property. | Land | Improvement |
|---|---|---|---|---|
| 2025 | $3,947 | $364,140 | $62,424 | $301,716 |
| 2024 | $2,474 | $357,000 | $61,200 | $295,800 |
| 2023 | $2,474 | $228,164 | $48,285 | $179,879 |
| 2022 | $2,403 | $223,691 | $47,339 | $176,352 |
| 2021 | $2,320 | $219,306 | $46,411 | $172,895 |
| 2020 | $2,309 | $217,059 | $45,936 | $171,123 |
| 2019 | $2,289 | $212,804 | $45,036 | $167,768 |
| 2018 | $2,261 | $208,632 | $44,153 | $164,479 |
| 2017 | $2,299 | $204,542 | $43,288 | $161,254 |
| 2016 | $2,149 | $200,533 | $42,440 | $158,093 |
| 2015 | $2,131 | $197,522 | $41,803 | $155,719 |
| 2014 | $2,114 | $193,654 | $40,985 | $152,669 |
Source: Public Records
Map
Nearby Homes
- 3293 Middleton Ln
- 3283 Middleton Ln
- 3178 Lawrence Rd
- 1091 Del Sol Place
- 1075 Le Brun Ln
- 2906 Regal Ave
- 3703 Harrow Ct
- 3466 Silverwood St
- 3425 Silverwood St
- 952 Camino Ct
- 1513 Harpole Rd
- 2820 Alfreda Way
- 3341 Timbercreek Dr
- 3527 Adams Ln
- 3428 Adams Ln
- 1556 Minor St
- 0 Churn Creek Rd Unit 25-496
- 0 Churn Creek Rd Unit 26-609
- 0 Churn Creek Rd Unit 25-5491
- 918 Parsons Dr
- 3315 Lawrence Rd
- 3327 Lawrence Rd
- 3309 Lawrence Rd
- 3333 Lawrence Rd
- 3320 Saint Moritz Ct
- 3303 Lawrence Rd
- 3339 Lawrence Rd
- 3308 Saint Moritz Ct
- 3318 Lawrence Rd
- 3324 Lawrence Rd
- 3312 Lawrence Rd
- 3330 Lawrence Rd
- 3325 Saint Moritz Ct
- 3345 Lawrence Rd
- 3313 Saint Moritz Ct
- 1423 Woodbridge Ct
- 1424 Augustine Way
- 1406 Woodbridge Ct
- 1436 Augustine Way
- 3351 Lawrence Rd
Your Personal Tour Guide
Ask me questions while you tour the home.