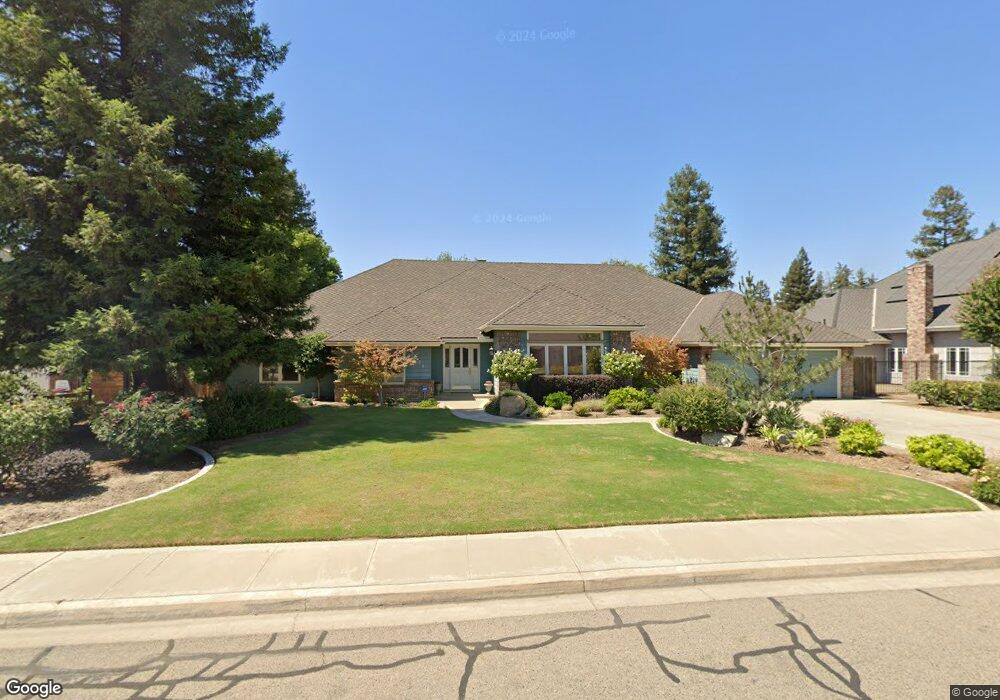
3321 S Bridge St Visalia, CA 93277
Mooney NeighborhoodEstimated Value: $642,040 - $700,000
4
Beds
3
Baths
3,131
Sq Ft
$214/Sq Ft
Est. Value
About This Home
This home is located at 3321 S Bridge St, Visalia, CA 93277 and is currently estimated at $670,260, approximately $214 per square foot. 3321 S Bridge St is a home located in Tulare County with nearby schools including Mountain View Elementary School, Divisadero Middle School, and Mt. Whitney High School.
Ownership History
Date
Name
Owned For
Owner Type
Purchase Details
Closed on
Sep 23, 2011
Sold by
Leigh Richard S
Bought by
Cotter Joseph F and Cotter Marsha
Current Estimated Value
Purchase Details
Closed on
Mar 2, 2005
Sold by
Walker Dale Arlen
Bought by
Leigh Richard S and Leigh Sandra J
Home Financials for this Owner
Home Financials are based on the most recent Mortgage that was taken out on this home.
Original Mortgage
$135,000
Interest Rate
5.77%
Mortgage Type
Purchase Money Mortgage
Purchase Details
Closed on
May 31, 2000
Sold by
Gonzales Moses
Bought by
Walker Dale Arlen and Walker Viola Jean
Purchase Details
Closed on
Jul 2, 1998
Sold by
Pawlowski Walter
Bought by
Gonzales Moses and Gonzales Linda R
Home Financials for this Owner
Home Financials are based on the most recent Mortgage that was taken out on this home.
Original Mortgage
$220,000
Interest Rate
6.9%
Create a Home Valuation Report for This Property
The Home Valuation Report is an in-depth analysis detailing your home's value as well as a comparison with similar homes in the area
Home Values in the Area
Average Home Value in this Area
Purchase History
| Date | Buyer | Sale Price | Title Company |
|---|---|---|---|
| Cotter Joseph F | $360,000 | Chicago Title Company | |
| Leigh Richard S | $505,000 | Chicago Title Co | |
| Walker Dale Arlen | $295,000 | Chicago Title Co | |
| Gonzales Moses | $285,000 | Fidelity National Title Co |
Source: Public Records
Mortgage History
| Date | Status | Borrower | Loan Amount |
|---|---|---|---|
| Previous Owner | Leigh Richard S | $135,000 | |
| Previous Owner | Gonzales Moses | $220,000 |
Source: Public Records
Tax History Compared to Growth
Tax History
| Year | Tax Paid | Tax Assessment Tax Assessment Total Assessment is a certain percentage of the fair market value that is determined by local assessors to be the total taxable value of land and additions on the property. | Land | Improvement |
|---|---|---|---|---|
| 2025 | $5,024 | $452,176 | $75,361 | $376,815 |
| 2024 | $5,024 | $443,311 | $73,884 | $369,427 |
| 2023 | $4,869 | $434,620 | $72,436 | $362,184 |
| 2022 | $4,641 | $426,099 | $71,016 | $355,083 |
| 2021 | $4,626 | $417,745 | $69,624 | $348,121 |
| 2020 | $4,585 | $413,461 | $68,910 | $344,551 |
| 2019 | $4,428 | $405,354 | $67,559 | $337,795 |
| 2018 | $4,320 | $397,406 | $66,234 | $331,172 |
| 2017 | $4,248 | $389,613 | $64,935 | $324,678 |
| 2016 | $4,173 | $381,974 | $63,662 | $318,312 |
| 2015 | $4,119 | $376,237 | $62,706 | $313,531 |
| 2014 | $4,036 | $368,867 | $61,478 | $307,389 |
Source: Public Records
Map
Nearby Homes
- 244 E Dorothea Ct
- 3226 S Tipton St
- 3316 S Tipton St
- 639 E South View Ave
- 816 E Copper Ave
- 136 W Loyola Ave
- 2905 S Encina St
- 1047 E Arlen Ave
- 0 S Burke St
- 3024 S Byrd St
- 2840 S West St
- 3831 S Watson St
- 303 E Elkhorn Ave
- 1138 E Packwood Ave
- 610 W Kimball Ave
- 134 W Kimball Ave
- 2537 S Encina St
- 144 E Reese Ave
- 605 W Russell Ave
- 2234 S Burke St
- 3305 S Bridge St
- 3335 S Bridge St
- 3310 S Garden St
- 249 E Paseo Ave
- 3304 S Garden St
- 3318 S Bridge St
- 3239 S Bridge St
- 3401 S Bridge St
- 246 E Chestnut Ct
- 3332 S Bridge St
- 250 E Chestnut Ct
- 3304 S Bridge St
- 3232 S Garden St
- 3400 S Bridge St
- 3240 S Bridge St
- 241 E Paseo Ave
- 242 E Chestnut Ct
- 3223 S Bridge St
- 3415 S Bridge St
- 249 E Chestnut Ct