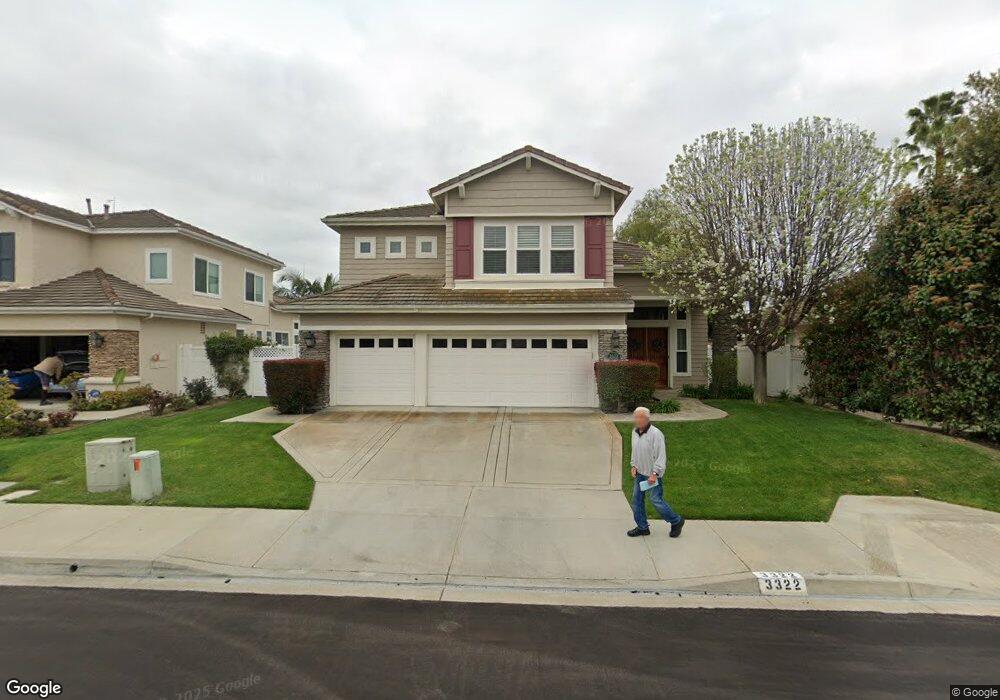
3322 Calle San Blas Carlsbad, CA 92009
La Costa NeighborhoodEstimated Value: $1,922,860 - $2,218,000
4
Beds
3
Baths
2,915
Sq Ft
$712/Sq Ft
Est. Value
About This Home
This home is located at 3322 Calle San Blas, Carlsbad, CA 92009 and is currently estimated at $2,075,965, approximately $712 per square foot. 3322 Calle San Blas is a home located in San Diego County with nearby schools including Mission Estancia Elementary School, Diegueno Middle School, and La Costa Canyon High School.
Ownership History
Date
Name
Owned For
Owner Type
Purchase Details
Closed on
Sep 11, 2009
Sold by
Fuller Christopher and Bartman Christine
Bought by
Yoo Ji Hyung and Kim Heesoo
Current Estimated Value
Home Financials for this Owner
Home Financials are based on the most recent Mortgage that was taken out on this home.
Original Mortgage
$656,000
Outstanding Balance
$425,960
Interest Rate
5.05%
Mortgage Type
New Conventional
Estimated Equity
$1,650,005
Purchase Details
Closed on
Mar 1, 1995
Sold by
California Pacific Homes Inc
Bought by
Fuller Christopher and Bartman Christine
Home Financials for this Owner
Home Financials are based on the most recent Mortgage that was taken out on this home.
Original Mortgage
$329,900
Interest Rate
8.9%
Create a Home Valuation Report for This Property
The Home Valuation Report is an in-depth analysis detailing your home's value as well as a comparison with similar homes in the area
Home Values in the Area
Average Home Value in this Area
Purchase History
| Date | Buyer | Sale Price | Title Company |
|---|---|---|---|
| Yoo Ji Hyung | $820,000 | Fidelity National Title Co | |
| Fuller Christopher | $367,000 | Chicago Title Company |
Source: Public Records
Mortgage History
| Date | Status | Borrower | Loan Amount |
|---|---|---|---|
| Open | Yoo Ji Hyung | $656,000 | |
| Previous Owner | Fuller Christopher | $329,900 |
Source: Public Records
Tax History Compared to Growth
Tax History
| Year | Tax Paid | Tax Assessment Tax Assessment Total Assessment is a certain percentage of the fair market value that is determined by local assessors to be the total taxable value of land and additions on the property. | Land | Improvement |
|---|---|---|---|---|
| 2025 | $11,587 | $1,064,382 | $516,324 | $548,058 |
| 2024 | $11,587 | $1,043,512 | $506,200 | $537,312 |
| 2023 | $11,275 | $1,023,052 | $496,275 | $526,777 |
| 2022 | $11,020 | $1,002,994 | $486,545 | $516,449 |
| 2021 | $10,849 | $983,328 | $477,005 | $506,323 |
| 2020 | $10,685 | $973,246 | $472,114 | $501,132 |
| 2019 | $10,469 | $954,163 | $462,857 | $491,306 |
| 2018 | $10,281 | $935,455 | $453,782 | $481,673 |
| 2017 | $92 | $917,114 | $444,885 | $472,229 |
| 2016 | $9,734 | $894,124 | $436,158 | $457,966 |
| 2015 | $9,571 | $880,694 | $429,607 | $451,087 |
| 2014 | $9,359 | $863,443 | $421,192 | $442,251 |
Source: Public Records
Map
Nearby Homes
- 7911 Terraza Disoma
- 7925 Calle Madrid
- 3514 Sitio Baya
- 8010 Calle Pinon
- 7702 Caminito Tingo Unit H203
- 8008 Avenida Secreto
- 1981 Avenida Joaquin
- Kestrel - Plan 4 at The Nest at La Costa
- Robin - Plan 3 at The Nest at La Costa
- Lark - Plan 1 at The Nest at La Costa
- Wren - Plan 2 at The Nest at La Costa
- Starling - Plan 5 at The Nest at La Costa
- 1931 Avenida Joaquin
- 3101 Levante St
- 0 Calle Rancho Vista Unit 18 250040119
- 721 Summersong Ln
- 1170 Rancho Encinitas Dr
- 1278 Avenida Miguel
- 2702 Jacaranda Ave
- 1633 Willowspring Dr N
- 3324 Calle San Blas
- 3320 Calle San Blas
- 3326 Calle San Blas
- 3318 Calle San Blas
- 3319 Avenida Anacapa
- 3334 Avenida Anacapa
- 3316 Calle San Blas
- 3328 Calle San Blas
- 3332 Avenida Anacapa
- 3317 Avenida Anacapa
- 7920 Via Ensenada
- 3314 Calle San Blas
- 3330 Calle San Blas
- 3313 Avenida Anacapa
- 3330 Avenida Anacapa
- 3315 Avenida Anacapa
- 3311 Avenida Anacapa
- 7918 Via Ensenada
- 3312 Calle San Blas
- 3332 Calle San Blas