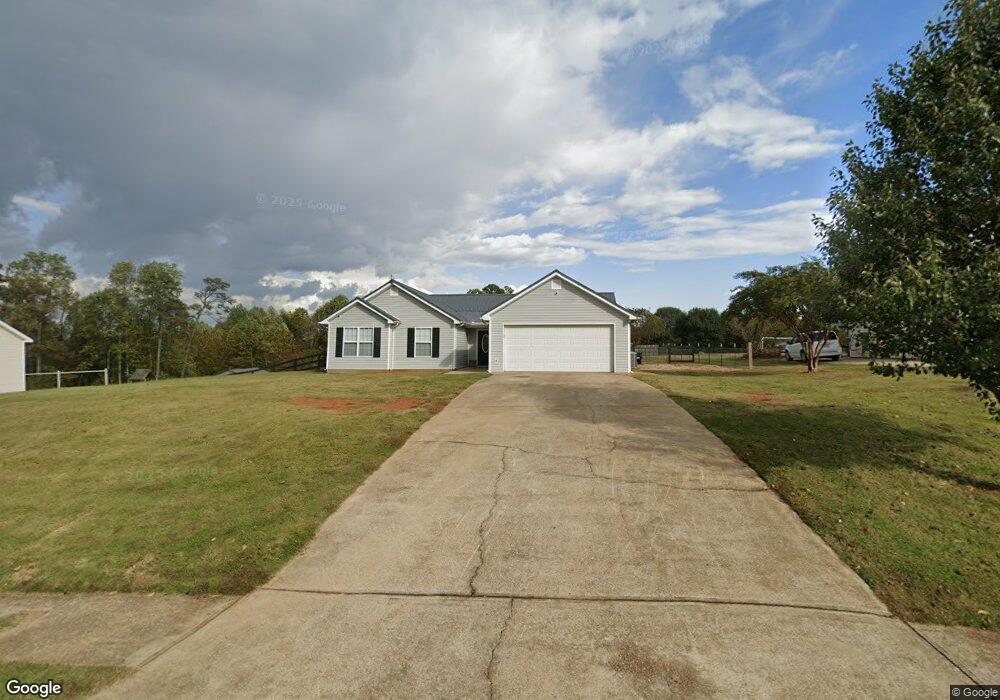
3322 Pennington Point Dr Unit 1 Gainesville, GA 30507
Estimated Value: $254,000 - $314,000
3
Beds
2
Baths
1,501
Sq Ft
$193/Sq Ft
Est. Value
About This Home
This home is located at 3322 Pennington Point Dr Unit 1, Gainesville, GA 30507 and is currently estimated at $289,882, approximately $193 per square foot. 3322 Pennington Point Dr Unit 1 is a home located in Hall County with nearby schools including Sugar Hill Elementary School, South Hall Middle School, and Johnson High School.
Ownership History
Date
Name
Owned For
Owner Type
Purchase Details
Closed on
Jun 19, 2018
Sold by
Bruce Jeremy Adam
Bought by
Bruce Jeremy Adam and Bruce Amy K
Current Estimated Value
Home Financials for this Owner
Home Financials are based on the most recent Mortgage that was taken out on this home.
Original Mortgage
$132,682
Outstanding Balance
$117,200
Interest Rate
5.5%
Mortgage Type
FHA
Estimated Equity
$172,682
Purchase Details
Closed on
May 16, 2003
Sold by
Southchase Properties Inc
Bought by
Bruce Jeremy Adam
Home Financials for this Owner
Home Financials are based on the most recent Mortgage that was taken out on this home.
Original Mortgage
$109,200
Interest Rate
5.81%
Mortgage Type
New Conventional
Purchase Details
Closed on
Mar 28, 2003
Sold by
Curtin Sidney M
Bought by
Southchase Properti9es Inc
Home Financials for this Owner
Home Financials are based on the most recent Mortgage that was taken out on this home.
Original Mortgage
$109,200
Interest Rate
5.81%
Mortgage Type
New Conventional
Purchase Details
Closed on
Feb 4, 2003
Sold by
B H W Investment Company Inc
Bought by
Silverwood Properties Inc
Create a Home Valuation Report for This Property
The Home Valuation Report is an in-depth analysis detailing your home's value as well as a comparison with similar homes in the area
Home Values in the Area
Average Home Value in this Area
Purchase History
| Date | Buyer | Sale Price | Title Company |
|---|---|---|---|
| Bruce Jeremy Adam | -- | -- | |
| Bruce Jeremy Adam | $109,000 | -- | |
| Southchase Properti9es Inc | $60,000 | -- | |
| Silverwood Properties Inc | $30,000 | -- |
Source: Public Records
Mortgage History
| Date | Status | Borrower | Loan Amount |
|---|---|---|---|
| Open | Bruce Jeremy Adam | $132,682 | |
| Previous Owner | Bruce Jeremy Adam | $109,200 |
Source: Public Records
Tax History Compared to Growth
Tax History
| Year | Tax Paid | Tax Assessment Tax Assessment Total Assessment is a certain percentage of the fair market value that is determined by local assessors to be the total taxable value of land and additions on the property. | Land | Improvement |
|---|---|---|---|---|
| 2024 | $2,324 | $87,000 | $11,560 | $75,440 |
| 2023 | $2,194 | $81,880 | $11,560 | $70,320 |
| 2022 | $2,105 | $75,160 | $9,160 | $66,000 |
| 2021 | $1,729 | $59,400 | $7,800 | $51,600 |
| 2020 | $1,701 | $56,720 | $7,800 | $48,920 |
| 2019 | $1,612 | $52,960 | $7,800 | $45,160 |
| 2018 | $1,441 | $47,160 | $7,800 | $39,360 |
| 2017 | $1,276 | $41,800 | $9,160 | $32,640 |
| 2016 | $1,097 | $36,240 | $5,480 | $30,760 |
| 2015 | $735 | $22,848 | $4,560 | $18,288 |
| 2014 | $735 | $22,848 | $4,560 | $18,288 |
Source: Public Records
Map
Nearby Homes
- 3358 Pennington Point Dr
- 3300 Athens Hwy
- 2997 Burton Cir
- 3501 Silver Wood Walk
- 3520 Silver Mist Cir
- 3738 Harmony Church Rd
- 2942 Salinger Way
- 3457 Silver Chase Ct
- 2860 Jack Bryant Cir
- 2811 Athens Hwy
- 2967 Maverick Trail
- 4239 Mangum Mill Rd
- 2709 Squires Rd
- 3188 Baker Rd
- 0 Baker Rd Unit 7640546
- 0 Baker Rd Unit 10593702
- 3484 Baker Rd
- 3185 Athens Hwy
- 3675 Roy Parks Rd
- 3326 Pennington Point Dr
- 3316 Pennington Point Dr Unit 1
- 3330 Pennington Point Dr
- 3317 Pennington Point Dr Unit 1
- 3310 Pennington Point Dr Unit 1
- 3325 Pennington Point Dr
- 3377 Bob Bryant Rd
- 3334 Pennington Point Dr
- 3313 Pennington Point Dr Unit 1
- 3333 Pennington Point Dr Unit 1
- 3321 Old Oak Ridge
- 3306 Pennington Point Dr Unit 1
- 3329 Old Oak Ridge
- 3309 Pennington Point Dr Unit 1
- 3313 Old Oak Ridge
- 3412 Sugar Hill Way Unit 1
- 3345 Pennington Point Dr
- 3337 Old Oak Ridge
- 3302 Pennington Point Dr Unit 1
- 3413 Sugar Hill Way Unit 1