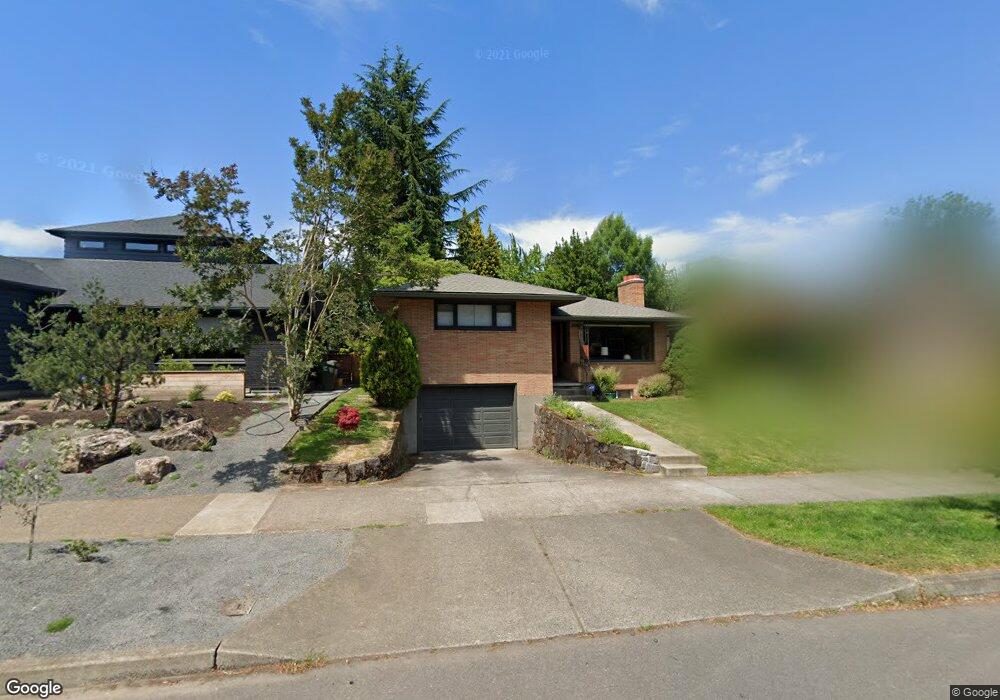
3323 E Burnside St Portland, OR 97214
Laurelhurst NeighborhoodEstimated Value: $873,546 - $1,176,000
4
Beds
3
Baths
2,712
Sq Ft
$353/Sq Ft
Est. Value
About This Home
This home is located at 3323 E Burnside St, Portland, OR 97214 and is currently estimated at $956,137, approximately $352 per square foot. 3323 E Burnside St is a home located in Multnomah County with nearby schools including Laurelhurst Elementary School, Grant High School, and Le Monde French Immersion Public Charter School.
Ownership History
Date
Name
Owned For
Owner Type
Purchase Details
Closed on
Dec 1, 2021
Sold by
Sorrell Matt and Sorrell Amanda
Bought by
Sorrell Amanda Beck and Sorrell Matthew Justin
Current Estimated Value
Purchase Details
Closed on
Oct 28, 2014
Sold by
Kc Acquisitions Llc
Bought by
Sorrell Matt and Sorrell Amanda
Home Financials for this Owner
Home Financials are based on the most recent Mortgage that was taken out on this home.
Original Mortgage
$345,000
Outstanding Balance
$264,704
Interest Rate
4.2%
Mortgage Type
New Conventional
Estimated Equity
$691,433
Purchase Details
Closed on
May 20, 2014
Sold by
Howk Eric
Bought by
Kc Acquisitions Llc
Purchase Details
Closed on
Feb 19, 2010
Sold by
Mezzina Crescenzo
Bought by
Howk Eric
Purchase Details
Closed on
Nov 13, 2008
Sold by
Hachiya David
Bought by
Mezzina Crescenzo and Mezzina Maria
Purchase Details
Closed on
Jan 10, 2001
Sold by
Nero Salvador J
Bought by
Nero Salvador J and The Salvador & Ora Nero Trust
Create a Home Valuation Report for This Property
The Home Valuation Report is an in-depth analysis detailing your home's value as well as a comparison with similar homes in the area
Home Values in the Area
Average Home Value in this Area
Purchase History
| Date | Buyer | Sale Price | Title Company |
|---|---|---|---|
| Sorrell Amanda Beck | -- | None Available | |
| Sorrell Matt | $690,000 | First American | |
| Kc Acquisitions Llc | $421,000 | Fidelity Natl Title Co Of Or | |
| Howk Eric | $420,000 | Fidelity Natl Title Co Of Or | |
| Mezzina Crescenzo | $466,990 | Accommodation | |
| Nero Salvador J | -- | -- |
Source: Public Records
Mortgage History
| Date | Status | Borrower | Loan Amount |
|---|---|---|---|
| Open | Sorrell Matt | $345,000 |
Source: Public Records
Tax History
| Year | Tax Paid | Tax Assessment Tax Assessment Total Assessment is a certain percentage of the fair market value that is determined by local assessors to be the total taxable value of land and additions on the property. | Land | Improvement |
|---|---|---|---|---|
| 2025 | $9,770 | $362,590 | -- | -- |
| 2024 | $9,419 | $352,030 | -- | -- |
| 2023 | $9,057 | $341,780 | $0 | $0 |
| 2022 | $8,861 | $331,830 | $0 | $0 |
| 2021 | $8,711 | $322,170 | $0 | $0 |
| 2020 | $7,991 | $312,790 | $0 | $0 |
| 2019 | $7,697 | $303,680 | $0 | $0 |
| 2018 | $7,471 | $294,840 | $0 | $0 |
| 2017 | $7,160 | $286,260 | $0 | $0 |
| 2016 | $6,553 | $277,930 | $0 | $0 |
Source: Public Records
Map
Nearby Homes
- 3136 NE Couch St
- 130 SE 31st Ave Unit 2
- 450 NE 32nd Ave
- 117 SE 30th Place
- 215 NE 30th Ave Unit 217
- 536 NE Hazelfern Place
- 428 SE 30th Place
- 2854 SE Ankeny St
- 3845 SE Ankeny St
- 28 SE 28th Ave Unit 304
- 3453 NE Irving St
- 716 SE 33rd Place
- 704 NE Hazelfern Place
- 2712 SE Ash St
- 407 SE 28th Ave Unit 409
- 515 SE Peacock Ln
- 610 SE Cesar Estrada Chavez Blvd
- 2820 NE Oregon St
- 824 SE 30th Ave
- 2625 SE Stark St
- 3309 E Burnside St
- 3331 E Burnside St
- 3265 E Burnside St
- 3337 E Burnside St
- 3306 NE Couch St
- 3326 NE Couch St
- 3336 NE Couch St
- 3264 NE Couch St
- 3255 E Burnside St
- 3349 E Burnside St
- 3256 NE Couch St
- 3316 E Burnside St
- 3348 NE Couch St
- 3308 E Burnside St
- 3328 E Burnside St
- 3245 E Burnside St
- 3357 E Burnside St
- 3338 E Burnside St
- 3266 E Burnside St
- 3244 NE Couch St
Your Personal Tour Guide
Ask me questions while you tour the home.