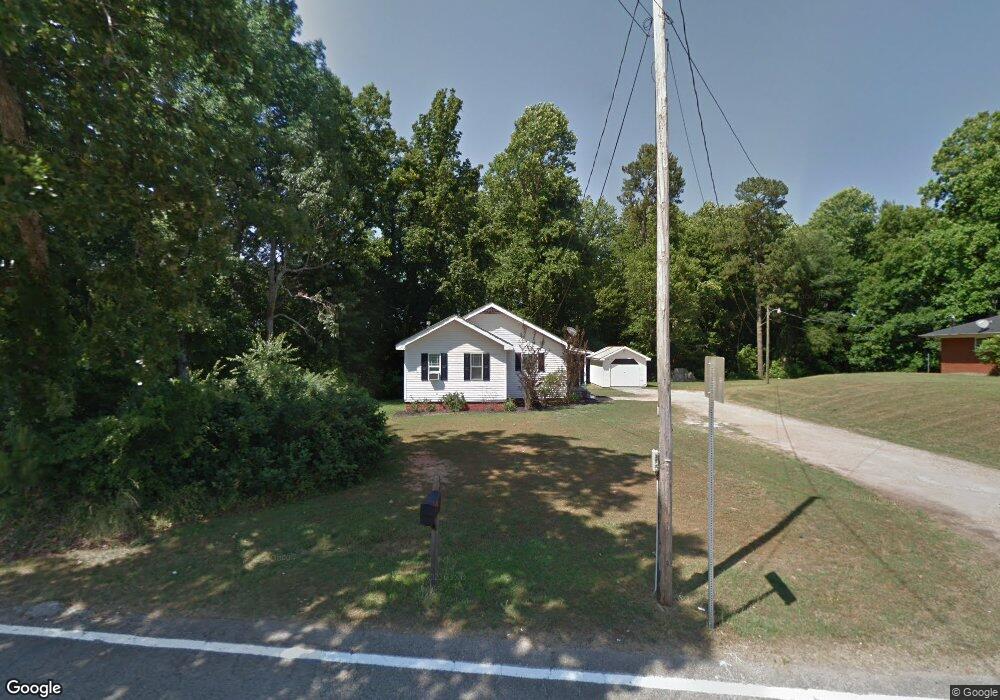
3323 Poplar Springs Rd Gainesville, GA 30507
Estimated Value: $167,000 - $303,000
1
Bed
2
Baths
606
Sq Ft
$353/Sq Ft
Est. Value
About This Home
This home is located at 3323 Poplar Springs Rd, Gainesville, GA 30507 and is currently estimated at $213,918, approximately $353 per square foot. 3323 Poplar Springs Rd is a home located in Hall County with nearby schools including Chicopee Elementary School, South Hall Middle School, and Johnson High School.
Ownership History
Date
Name
Owned For
Owner Type
Purchase Details
Closed on
Jun 3, 2016
Sold by
West Mark Todd
Bought by
Ayers Anderson L and Ayers Edward
Current Estimated Value
Home Financials for this Owner
Home Financials are based on the most recent Mortgage that was taken out on this home.
Original Mortgage
$48,000
Outstanding Balance
$29,443
Interest Rate
3.61%
Mortgage Type
New Conventional
Estimated Equity
$184,475
Purchase Details
Closed on
Feb 17, 2016
Sold by
West Mark Todd
Bought by
Puckett Tyler Joel and Spataro Summer D
Home Financials for this Owner
Home Financials are based on the most recent Mortgage that was taken out on this home.
Original Mortgage
$129,609
Interest Rate
4.12%
Mortgage Type
FHA
Purchase Details
Closed on
Nov 17, 2000
Sold by
West James H
Bought by
West Sarah Georgia
Create a Home Valuation Report for This Property
The Home Valuation Report is an in-depth analysis detailing your home's value as well as a comparison with similar homes in the area
Home Values in the Area
Average Home Value in this Area
Purchase History
| Date | Buyer | Sale Price | Title Company |
|---|---|---|---|
| Ayers Anderson L | $60,000 | -- | |
| Puckett Tyler Joel | $132,000 | -- | |
| West Sarah Georgia | -- | -- |
Source: Public Records
Mortgage History
| Date | Status | Borrower | Loan Amount |
|---|---|---|---|
| Open | Ayers Anderson L | $48,000 | |
| Previous Owner | Puckett Tyler Joel | $129,609 |
Source: Public Records
Tax History Compared to Growth
Tax History
| Year | Tax Paid | Tax Assessment Tax Assessment Total Assessment is a certain percentage of the fair market value that is determined by local assessors to be the total taxable value of land and additions on the property. | Land | Improvement |
|---|---|---|---|---|
| 2025 | $1,509 | $62,148 | $37,920 | $24,228 |
| 2024 | $1,561 | $62,148 | $37,920 | $24,228 |
| 2023 | $1,217 | $64,068 | $37,920 | $26,148 |
| 2022 | $630 | $23,508 | $16,000 | $7,508 |
| 2021 | $621 | $22,788 | $16,000 | $6,788 |
| 2020 | $543 | $19,348 | $13,120 | $6,228 |
| 2019 | $550 | $19,428 | $13,800 | $5,628 |
| 2018 | $626 | $18,908 | $13,800 | $5,108 |
| 2017 | $674 | $18,828 | $13,800 | $5,028 |
| 2016 | $1,253 | $40,612 | $16,840 | $23,772 |
| 2015 | $1,106 | $34,902 | $8,480 | $26,422 |
| 2014 | $1,106 | $34,902 | $8,480 | $26,422 |
Source: Public Records
Map
Nearby Homes
- 3607 Wood Point Way
- 4013 Amberleigh Trace
- 4044 Amberleigh Trace
- 3617 Winder Hwy
- 3969 Bolding Rd
- 3583 Atlanta Hwy
- 5117 Fox Den Rd
- 5209 Fox Den Rd
- 2708 Valley Green Dr
- 2948 Colony Ct
- 2755 Valley Green Dr Unit 72
- 2755 Valley Green Dr
- 4287 Skyline View
- 3667 Acorn Dr
- 3927 Celtic Ct
- 0 Marble Arch Way
- 4315 Marble Arch Way
- 3827 Chadwick Dr
- 3732 Acorn Dr
- 3929 Perry Ln
- 3327 Poplar Springs Rd
- 3442 Abbey Way
- 3500 Abbey Way
- 3494 Abbey Way
- 3490 Abbey Way
- 3504 Abbey Way
- 3486 Abbey Way Unit 9
- 3486 Abbey Way
- 3482 Abbey Way
- 3512 Abbey Way
- 3474 Abbey Way
- 3508 Abbey Way
- 3508 Abbey Way Unit 96
- 3375 Abbey Way
- 3717 Abbey Way
- 3705 Abbey Way
- 3705 Abbey Way Unit 42
- 3389 Abbey Way
- 3389 Abbey Way Unit 97
- 3303 Abbey Way Unit 42