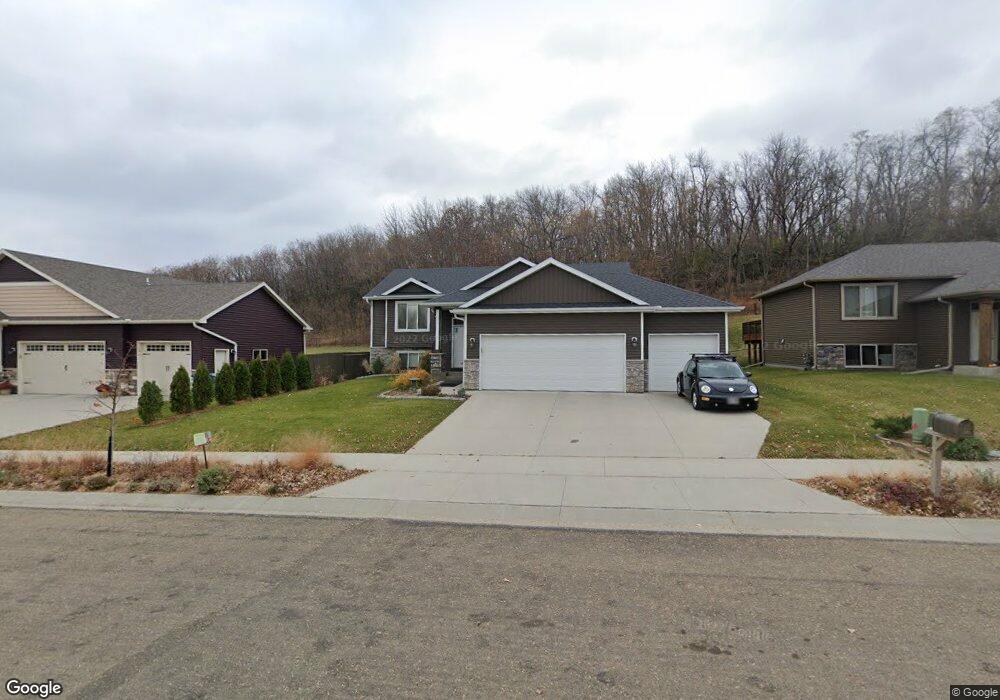
3323 Ridgeline Dr SE Unit 206 Rochester, MN 55904
Estimated Value: $482,000 - $491,508
4
Beds
3
Baths
1,293
Sq Ft
$375/Sq Ft
Est. Value
About This Home
This home is located at 3323 Ridgeline Dr SE Unit 206, Rochester, MN 55904 and is currently estimated at $485,127, approximately $375 per square foot. 3323 Ridgeline Dr SE Unit 206 is a home located in Olmsted County with nearby schools including Riverside Central Elementary School, Kellogg Middle School, and Century Senior High School.
Ownership History
Date
Name
Owned For
Owner Type
Purchase Details
Closed on
May 31, 2019
Sold by
Welton John J and Welton Jamie E
Bought by
Baker Darren J
Current Estimated Value
Home Financials for this Owner
Home Financials are based on the most recent Mortgage that was taken out on this home.
Original Mortgage
$250,000
Outstanding Balance
$220,252
Interest Rate
4.2%
Mortgage Type
New Conventional
Estimated Equity
$264,875
Purchase Details
Closed on
Aug 10, 2017
Sold by
Berge Builders Llc
Bought by
Welton Jamie E and Welton John J
Home Financials for this Owner
Home Financials are based on the most recent Mortgage that was taken out on this home.
Original Mortgage
$264,960
Interest Rate
4.03%
Mortgage Type
New Conventional
Purchase Details
Closed on
Jul 19, 2016
Sold by
Holsten Theodore W
Bought by
Stonebridge Partners Llc
Create a Home Valuation Report for This Property
The Home Valuation Report is an in-depth analysis detailing your home's value as well as a comparison with similar homes in the area
Home Values in the Area
Average Home Value in this Area
Purchase History
| Date | Buyer | Sale Price | Title Company |
|---|---|---|---|
| Baker Darren J | $345,000 | Edina Realty Title Inc | |
| Welton Jamie E | $331,200 | None Available | |
| Berge Builders Llc | -- | None Available | |
| Stonebridge Partners Llc | $275,000 | Attorney |
Source: Public Records
Mortgage History
| Date | Status | Borrower | Loan Amount |
|---|---|---|---|
| Open | Baker Darren J | $250,000 | |
| Previous Owner | Welton Jamie E | $264,960 |
Source: Public Records
Tax History Compared to Growth
Tax History
| Year | Tax Paid | Tax Assessment Tax Assessment Total Assessment is a certain percentage of the fair market value that is determined by local assessors to be the total taxable value of land and additions on the property. | Land | Improvement |
|---|---|---|---|---|
| 2024 | $5,890 | $424,700 | $60,000 | $364,700 |
| 2023 | $5,360 | $421,800 | $60,000 | $361,800 |
| 2022 | $4,758 | $391,000 | $60,000 | $331,000 |
| 2021 | $4,612 | $350,800 | $60,000 | $290,800 |
| 2020 | $4,652 | $340,500 | $60,000 | $280,500 |
| 2019 | $4,248 | $330,400 | $60,000 | $270,400 |
| 2018 | $88 | $305,500 | $60,000 | $245,500 |
| 2017 | $88 | $5,000 | $5,000 | $0 |
| 2016 | $92 | $5,000 | $5,000 | $0 |
| 2015 | $86 | $5,000 | $5,000 | $0 |
| 2014 | $86 | $5,000 | $5,000 | $0 |
| 2012 | -- | $5,000 | $5,000 | $0 |
Source: Public Records
Map
Nearby Homes
- 3507 Ridgeline Dr SE
- 3585 Bridgeview Dr SE
- 3415 College View Rd E
- 3630 Strathmore Ln SE
- 167 Stonelake Dr SE
- 239 Stonelake Dr SE
- 251 Stonelake Dr SE
- 354 Brookestone Dr SE
- 2745 Sand Trap Rd SE
- 4163 Horseshoe Ct NE
- 2887 Knollwood Dr SE
- 4113 Trumpeter Dr SE
- 4094 Trumpeter Dr SE
- 1081 Century Village Ln NE
- 1077 Century Village Ln NE
- 1069 Century Village Ln NE
- 1073 Century Village Ln NE
- 1097 Century Village Ln NE
- 1085 Century Village Ln NE
- 1109 Century Village Ln NE
- 3323 Ridgeline Dr SE
- 3337 Ridgeline Dr SE
- 3309 Ridgeline Dr SE
- 3361 Ridgeline Dr SE
- 3320 Bridgeview Dr SE
- 3367 Ridgeline Dr SE
- 3346 Ridgeline Dr SE
- 3332 Bridgeview Dr SE
- 3360 Ridgeline Dr SE
- 3381 Ridgeline Dr SE
- 3374 Ridgeline Dr SE
- 3344 Bridgeview Dr SE
- 3341 Bridgeview Dr SE
- 3388 Ridgeline Dr SE
- 3356 Bridgeview Dr SE
- 3353 Bridgeview Dr SE
- 3409 Ridgeline Dr SE
- 3402 Ridgeline Dr SE
- 213 Bridgeview Ln SE
- 3365 Bridgeview Dr SE