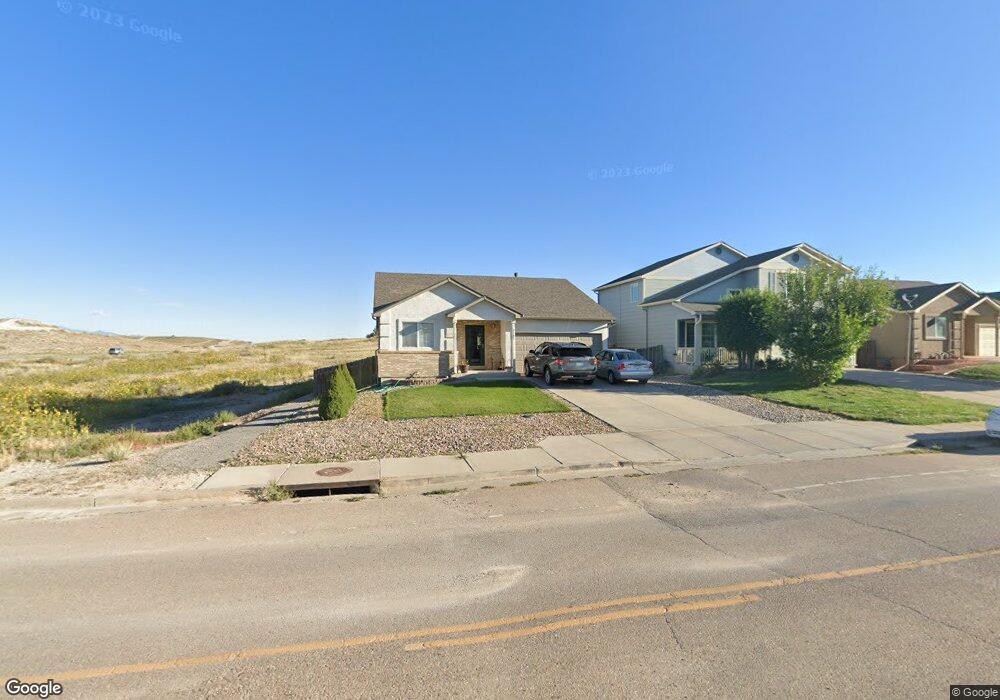
3323 W 18th St Pueblo, CO 81003
Hyde Park NeighborhoodEstimated Value: $282,000 - $332,000
3
Beds
2
Baths
1,401
Sq Ft
$222/Sq Ft
Est. Value
About This Home
This home is located at 3323 W 18th St, Pueblo, CO 81003 and is currently estimated at $310,354, approximately $221 per square foot. 3323 W 18th St is a home located in Pueblo County with nearby schools including Irving Elementary School, Risley International Academy of Innovation, and Centennial High School.
Ownership History
Date
Name
Owned For
Owner Type
Purchase Details
Closed on
Oct 19, 2011
Sold by
Federal Home Loan Mortgage Corporation
Bought by
Vigil Lloyd
Current Estimated Value
Home Financials for this Owner
Home Financials are based on the most recent Mortgage that was taken out on this home.
Original Mortgage
$92,591
Outstanding Balance
$63,303
Interest Rate
4.15%
Mortgage Type
FHA
Estimated Equity
$247,051
Purchase Details
Closed on
Nov 2, 2005
Sold by
Heritage Homes Inc
Bought by
Deleon Raymond and Deleon Jocelyn
Home Financials for this Owner
Home Financials are based on the most recent Mortgage that was taken out on this home.
Original Mortgage
$29,800
Interest Rate
5.75%
Mortgage Type
Credit Line Revolving
Purchase Details
Closed on
Mar 4, 2002
Sold by
Midwest Const Corp
Bought by
Todays Land Company Llc
Purchase Details
Closed on
Feb 7, 2001
Bought by
Midwest Const Corp
Create a Home Valuation Report for This Property
The Home Valuation Report is an in-depth analysis detailing your home's value as well as a comparison with similar homes in the area
Home Values in the Area
Average Home Value in this Area
Purchase History
| Date | Buyer | Sale Price | Title Company |
|---|---|---|---|
| Vigil Lloyd | $95,000 | Servicelink | |
| Deleon Raymond | $149,440 | Stewart Title Of Pueblo | |
| Todays Land Company Llc | $1,361,000 | -- | |
| Midwest Const Corp | -- | -- |
Source: Public Records
Mortgage History
| Date | Status | Borrower | Loan Amount |
|---|---|---|---|
| Open | Vigil Lloyd | $92,591 | |
| Previous Owner | Deleon Raymond | $29,800 | |
| Previous Owner | Deleon Raymond | $119,200 |
Source: Public Records
Tax History Compared to Growth
Tax History
| Year | Tax Paid | Tax Assessment Tax Assessment Total Assessment is a certain percentage of the fair market value that is determined by local assessors to be the total taxable value of land and additions on the property. | Land | Improvement |
|---|---|---|---|---|
| 2024 | $1,486 | $15,150 | -- | -- |
| 2023 | $1,502 | $18,840 | $1,010 | $17,830 |
| 2022 | $1,272 | $12,814 | $1,040 | $11,774 |
| 2021 | $1,312 | $13,180 | $1,070 | $12,110 |
| 2020 | $1,263 | $13,180 | $1,070 | $12,110 |
| 2019 | $1,264 | $12,516 | $1,073 | $11,443 |
| 2018 | $975 | $10,758 | $1,080 | $9,678 |
| 2017 | $985 | $10,758 | $1,080 | $9,678 |
| 2016 | $914 | $10,064 | $1,194 | $8,870 |
| 2015 | $911 | $10,064 | $1,194 | $8,870 |
| 2014 | $835 | $9,212 | $1,194 | $8,018 |
Source: Public Records
Map
Nearby Homes
- 3117 W 18th St
- 00000 Newport Ave
- 2200 Lewis Ave
- TBD Garnett St
- 4100 W 11th St
- 2434 W 19th St
- 3530 W 11th St
- 2423 W 19th St
- 2701 W 11th St
- 2402 W 17th St
- 2408 W 15th St
- 2900 W 11th St
- 2337 Cruz Ct
- 2318 W 17th St
- 2308 W 14th St
- 2204 W 22nd St
- 2215 W 14th St
- 2206 W 16th St
- 2108 W 19th St
- 2615 Lambert Ave
- 3319 W 18th St
- 3315 W 18th St
- 3311 W 18th St
- 3324 W 18th St Unit 2
- 3307 W 18th St
- 3322 W 18th St
- 3320 W 18th St
- 3314 W 18th St
- 3301 W 18th St
- 3310 W 18th St
- 3306 W 18th St
- TBD Thomas St
- 3302 W 18th St Unit 6
- 3302 W 18th St
- 3300 18th St Unit 6
- 3237 W 18th St
- 3233 W 18th St
- 3238 W 18th St
- 3234 W 18th St
- 3229 W 18th St